How the Per Capita Income has fared in all the five poll-bound states – economic growth
There are various indicators associated with the development of a country, not primarily restricted to the per capita income i.e., the economic growth. In India, however, both economic growth and development are used interchangeably, for politicians who associate economic growth, or more precisely the gross domestic product growth, for development in their political promises and pre-election innuendos.
While we’ve seen these tactics of competitive populism rarely turn into reality in terms of kept promises, oppositions and critics hold the gross domestic product numbers up close to challenge the government’s promises of developments, and the people, with almost little to no information about the background of these indicators, also put their absolute faith in it.


Nonetheless, another election season is approaching and a whole new wave of political bids and attempts to stay/ gain power has begun. Just last week, the critics and ruling government’s extreme justifications about India’s economic recovery based on the quarterly Gross Domestic Product numbers were making headlines.
While we confronted that none of them had been telling the entire truth, it also could not be denied that the country’s economy is in a fragile position. Therefore, the ruling government has been announcing some politically large measures like the telecom relief package and the bad banks’ declaration to take the attention off of the terrible growth, employment and inflation numbers.
Even though these attempts have been made at a country-wise level, there are five states that have been receiving utmost attention owing to their ongoing, and or upcoming, polls and the different political parties’ bid to win. While the change in party representation would keep pushing through as we come close to the attention, there’s also one very significant parameter that would receive attention in the days to come- the economic performance of the electoral state.
There has been proven to be a significant correlation between economic performance and electoral win, provided the apparent competitive populist bid remains neutral. This means that the opposition would be bringing up these growth numbers if indicators would have worsened, or the ruling party would be boasting if they have improved.
But who would tell if these numbers have improved or worsened? More precisely, how would get to know the economic performance of the poll-bound states in the said period?
Well, let me take you to our master-guide, the “handbook of Statistics on the Indian Economy, 2020-21.” This handbook serves justice to its name in literal senses since it is the annual publication published by the Reserve Bank of India that provides detailed historical on a wide variety of parameters for the country as a whole, as well as for different states.
This report serves as the basis for a large number of academic researches, policy formulations, as well as economic modelling for the country since it provides all possible required data in one place.
Per Capita Income Net State Domestic Product
This handbook contains in it a parameter called the “per capita Net State Domestic Product.” This variable is an assessment of the per capita income levels at a state-wise distribution, and also presents an account of it over the years for comparative purposes.
Even though averages are inflated measures of economic well-being in a country with such extreme income inequalities, it is at the end one of the most important metrics for the assessment of the economic performance of a state as well as the well-being of its people.
Let’s assess what the report says about the five states that are going to witness the election in March 2022, and understand how these states have fared in economic terms in the past period. These states are Uttar Pradesh, Uttarakhand, Punjab, Goa and Manipur.
One significant way to assess economic performance in these states using the per capita Net State Domestic Product is to-
1.List through the absolute levels in each of the five states.
2.Compare them with the national average to get an idea of the economic positioning of the state.
For that, it is important to note that the per capita national average for India stands at INR 95,000. Again, per capita is not the fairest description of the economic position of every citizen given the huge income inequalities, but it is all we have so that’s what we’ll go with.
Nonetheless, the per capita Net State Domestic Product for Goa stands at Rs 3.04 lakh, for Uttarakhand Rs 1.59 lakh and Punjab at Rs 1.19 Lakh. As can be seen from the absolute figures, the three states of the country are vividly above the national average numbers in terms of per capita income and are position fairly well in the country’s economic positioning. As for the other two, however, the situation is a little grimmer.
As for Manipur, the per capita Net State Domestic Product stands at Rs 54,000 and for Uttar Pradesh at Rs 44,600, barely half the national average and much lower than their election counterparts. This variance between states is a matter of a lot of economic discussions and is a result of a number of variables, which, however, is a topic for another conversation.
For now, let’s move to a broader analysis of intra-state assessments because it is unlikely that the difference between the per capita Net State Domestic Product of two states would have much impact on the electoral inclination of any state’s voting members.
Uttar Pradesh-
Well, it would be fair to separate the three years of FY18-FY20 of the respective state government’s five-year tenure ending this fiscal year because it is the pre-Covid term of the government, and we all know how the country’s economy fared during the post-pandemic period.

UP’s economy has been one of the biggest among all states, but its performance during the said 3 years of BJP rule has had a terrible impact on it. This is reflected in the 2.99 per cent per capita Net State Domestic Product growth as opposed to the 5 per cent growth in the same parameter during FY13-FY17, under the Samajwadi Party rule.
Not only that, but it is also significantly lower than the national average of 4.6 per cent during the said period, and is being reflected in the lesser than average per capita income.
Even if the recovery trajectory is taken as that the entire loss in Fy21 would be covered in FY22, even then we can expect the annual growth rate of per capita income of just 1.8% for the full five-year term from FY18 to FY22. This is in comparison to the 2.7 per cent national average in the said period, clearly showing how far is the state lagging currently.
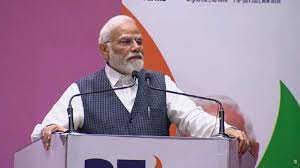
According to ANI, On September 5, UP Chief Minister reportedly said: “In the next 5 years, per capita income of Uttar Pradesh will exceed the country’s per capita income”.
Well, looks like there’s some supposed magic pending to happen, because it would be achieved at an annual growth rate of 22 per cent, provided the national economy grows at merely 5 per cent in each period.
Just to refresh your memory, let me remind you the state’s registration of merely 2.9 per cent annual growth in the three pre-Covid years. Is it something like another 5 trillion-dollar fairytale for the people of the UP?
Punjab-
A similar story has reigned for the Congress government in Punjab too, with a registered growth of 4 per cent being less than the national average, as well as the growth during the former government, SAD-BJP’s rule at 4.3 per cent.
If a similar assumption of the recovery is made, the state would register an annual growth rate of merely 2.4 per cent for its five-year term.
Goa-
In Goa’s state, however, the comparison of the BJP government in the three pre-covid years is with itself only, in the FY13-FY17 period. The trajectory, however, is the most astonishing for the two periods.
As opposed to the 3.4 per cent per capita Net State Domestic Product growth in FY13-17, which was less than the national average of 5.5 per cent in itself, the growth in FY18-20 has actually been negative. So, in all likelihood, we can consider the per capita income of Goa being lower at the end of FY22 than it was in FY18. This contraction comes as an aftermath of a mere 3.4 per cent annual growth during FY13 and FY17.
Taken together — Fy13 to FY17 and FY18 to Fy22 — per capita income would have grown at an annual rate of just 1.6% in the past decade of the BJP rule.
Uttarakhand-
Even with a three-time change in the Chief Minister in the past four years of BJP rule in the state, Uttarakhand has registered an above0average growth in the entire decade, with the numbers being around 6.7 per cent in FY13-17, and 4.6 per cent in the three-year pre-Covid period, in sync with the national average.
Manipur-
Manipur has witnessed a significant increase in their per-capita income in the three pre-Covid years at the annual rate of 4.6 per cent during the BJP rule, as opposed to the 3.5 per cent annual growth rate in the five-years preceding it of the congress rule.
Even though the pandemic did have a negative impact on the per capita levels of the state, it is likely that the deceleration and recovery would be in sync with the national average, a good sign for the state.
Edited by Sanjana Simlai.