Sweeping Shifts in Tax Landscape: A Comparative Analysis of Individual Income Tax Filing in 2022-23 and 2013-14

Sweeping Shifts in Tax Landscape: A Comparative Analysis of Individual Income Tax Filing in 2022-23 and 2013-14
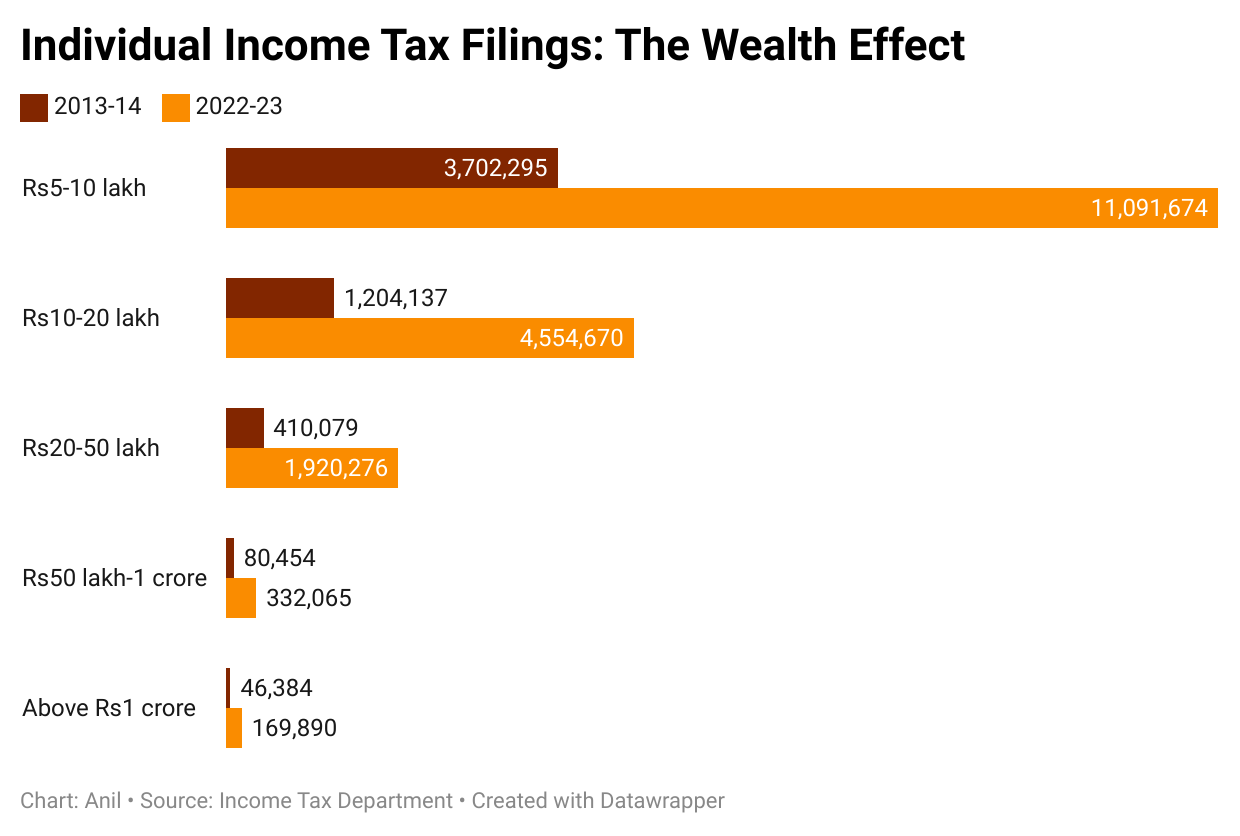
In a groundbreaking revelation, the government has unveiled a graph that vividly portrays the marked disparities in individual income tax filing between the fiscal years 2022-23 and 2013-14. This compelling visual representation underscores the transformative changes that have reshaped the taxation landscape over the past decade, shedding light on key trends that have shaped the financial responsibilities of citizens.


Understanding the Graph
The power-packed graph, meticulously designed by experts, captures the intricate nuances of individual income tax filing. Its x-axis charts the fiscal years, showcasing 2013-14 and 2022-23, while the y-axis elegantly traces the percentage of income tax paid. The two lines on the graph, each representing a respective fiscal year, weave a tale of evolving fiscal policies and economic dynamics.
Shifts in Tax Burden
A pronounced contrast leaps forth as one delves into the heart of the graph. In 2013-14, the curve rises steeply, reflecting a higher percentage of income tax that individuals were required to contribute. Fast forward to 2022-23, and the trajectory is notably different – a testament to the government’s efforts to reconfigure the tax framework. The line tapers gently, indicating a moderation in the tax burden on individual citizens.
Progressive Taxation at Play
One of the most compelling narratives spun by this graph revolves around the concept of progressive taxation. In 2013-14, the tax structure appeared relatively rigid, disproportionately affecting individuals across income brackets. A higher percentage of taxation on lower income earners was evident, exacerbating financial disparities. The 2022-23 curve, however, showcases a departure from this trend, reflecting a more equitable distribution of tax responsibility.
Policy Interventions and Economic Impacts
Behind the lines and figures lie a series of policy interventions that have orchestrated this transformation. The graph serves as a mirror to measures aimed at fostering economic growth, incentivizing investments, and nurturing a robust consumer spending environment. The shift in the tax burden is not just about numbers, but about a concerted effort to create an economic ecosystem that thrives on balance and fairness.
Tech-Driven Tax Compliance
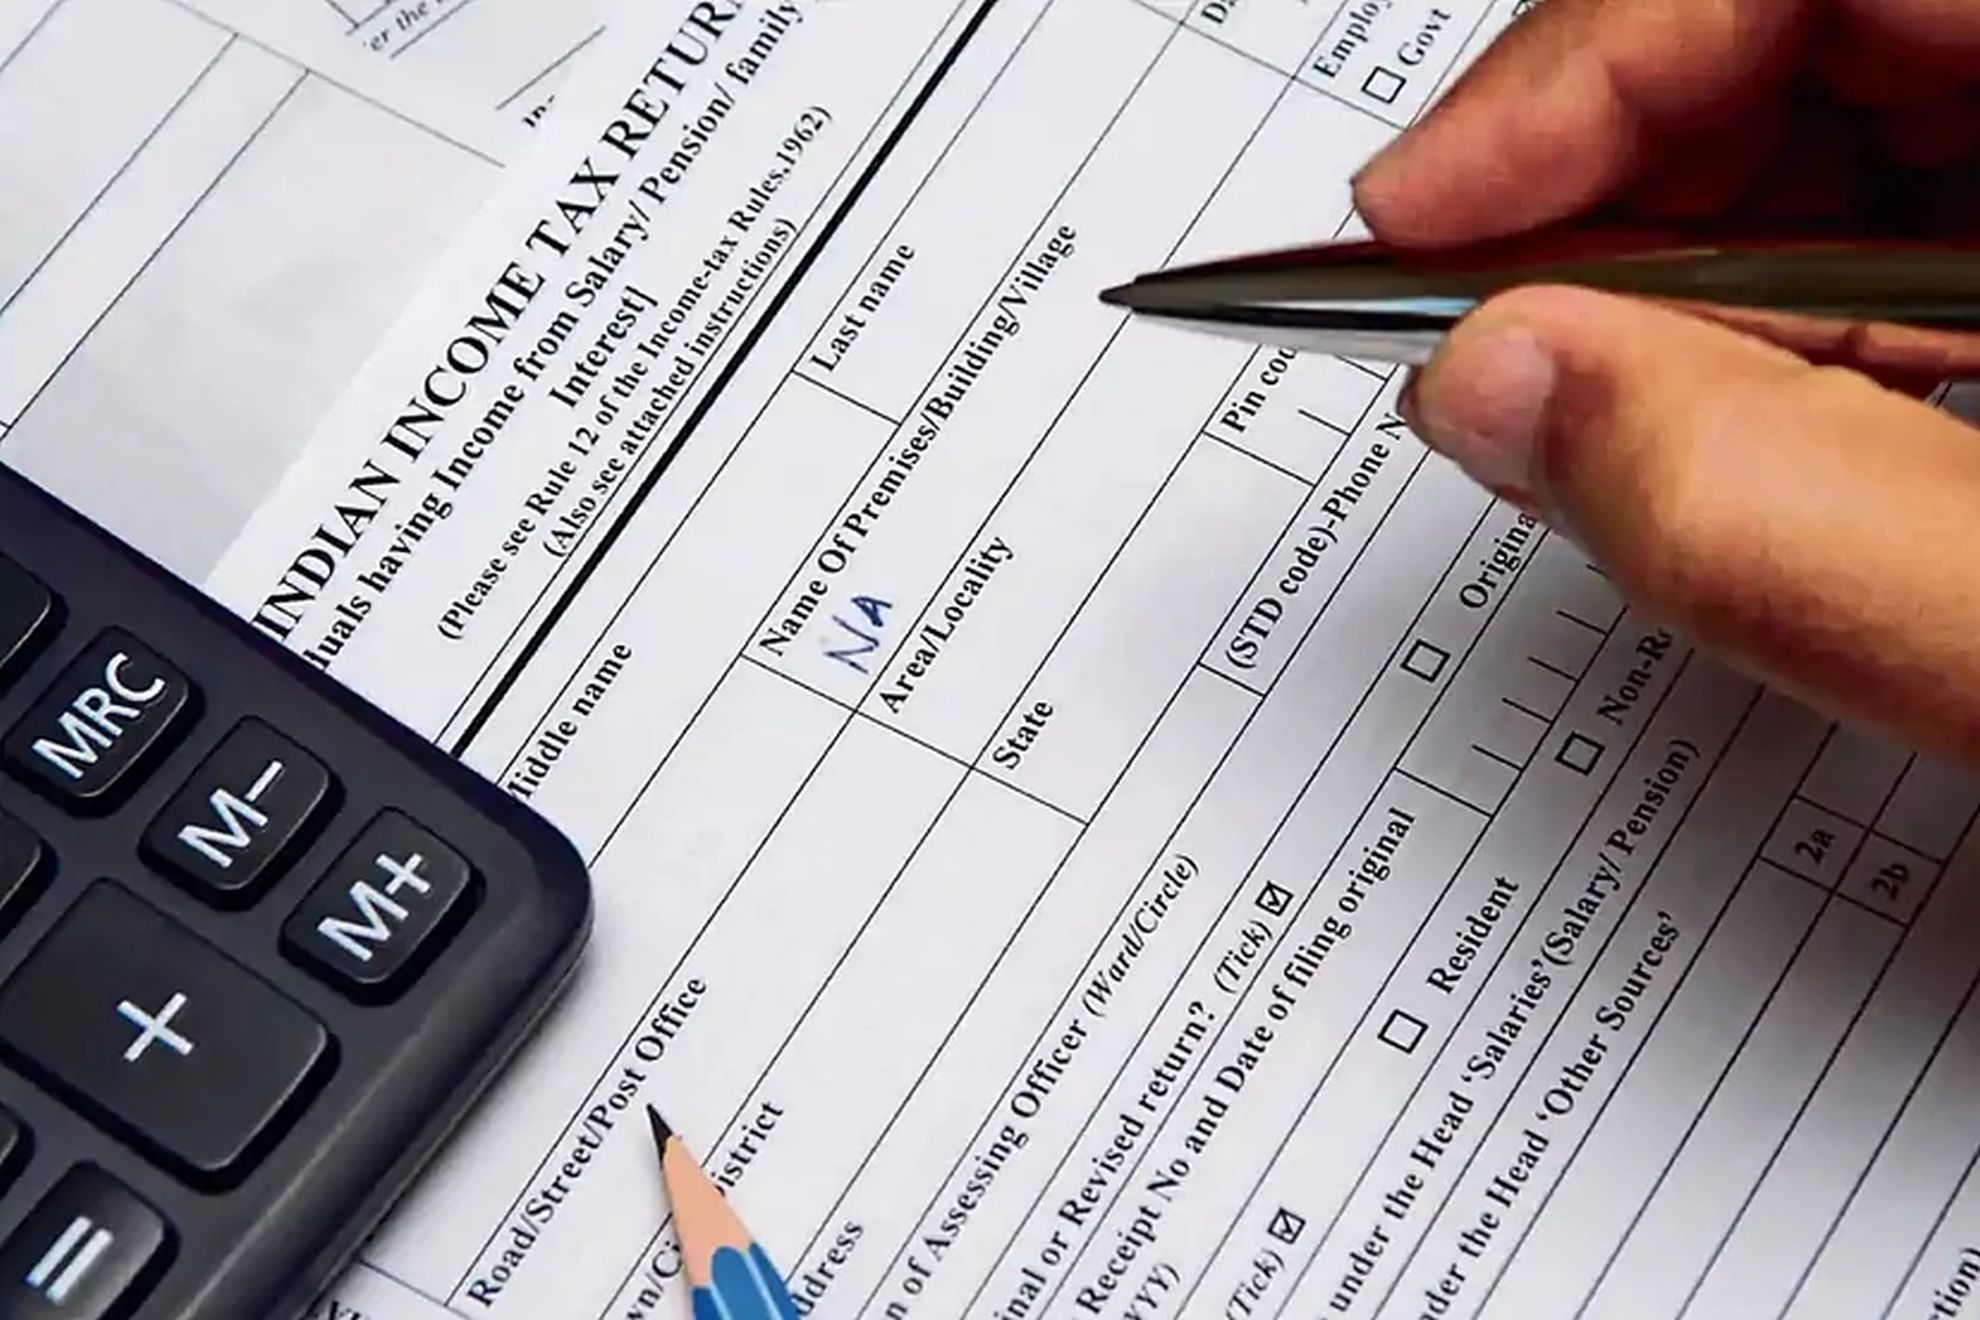
A significant aspect that emerges from this graphical analysis is the technological revolution that has revolutionized tax compliance. The era of paper-heavy filing in 2013-14 stands in stark contrast to the streamlined, digitized processes of 2022-23. The latter has been empowered by intuitive tax-filing platforms, simplifying the process for individuals and minimizing errors. This transition from manual to digital underscores the government’s commitment to efficiency and ease of doing business.
Savings and Investments: A New Paradigm
Embedded within the graph’s intricacies is a profound narrative of incentivizing savings and investments. The upward trajectory of the 2013-14 curve hinted at a less encouraging scenario for investors and savers, potentially disincentivizing the culture of financial prudence. In contrast, the flatter curve of 2022-23 is emblematic of a policy landscape that recognizes the pivotal role of savings and investments in the nation’s economic growth.
The Social Fabric and Inclusivity
At the crux of this graph lies the fundamental ethos of inclusivity. The shift in the tax paradigm from 2013-14 to 2022-23 mirrors the government’s commitment to empowering citizens from all walks of life. By redistributing the tax burden, policies have been crafted to be more sensitive to the diverse financial capacities of individuals, thereby fostering a more inclusive and harmonious society.
Environmental Consciousness: A Silent Player
While the graph primarily centers on income tax, it indirectly echoes the government’s environmental consciousness. In 2022-23, the efforts towards greener practices and sustainable living are subtly mirrored in the streamlined tax policies. A government mindful of ecological imperatives is one that acknowledges the role of citizens in realizing environmental goals while balancing their economic aspirations.
Embracing Digital Literacy: A Catalyst for Tax Transformation
Amidst the contrasting lines and percentages, there’s an underlying tale of digital literacy shaping the tax landscape. The 2013-14 curve signifies an era when individuals grappled with cumbersome paperwork and long queues at tax offices. This scenario, while familiar to many, was far from conducive to encouraging tax compliance. The 2022-23 curve, however, unveils a landscape transformed by digital solutions. With user-friendly online platforms and accessible resources, taxpayers are no longer daunted by the process. The graph thus reflects not just a financial evolution, but a technological one, where citizens have embraced digital literacy to seamlessly fulfill their tax obligations.

Dynamic Workforce Realities and Tax Implications
Nestled within the graph’s lines is a silent commentary on the shifting nature of the workforce. The 2013-14 curve hints at a traditional work landscape, where individuals relied more heavily on stable, full-time employment. Fast forward to 2022-23, and the picture is one of diversification – the gig economy, freelancing, and remote work have become increasingly prevalent. This transformation, albeit not explicitly captured in the graph, echoes in the nuanced changes in tax percentages. The government’s ability to adapt tax policies to accommodate these evolving work dynamics is a testament to its flexibility and responsiveness.
Global Economic Flux: Navigating Tax Challenges
While the graph’s primary focus is on domestic tax trends, it inadvertently reflects a broader context of global economic flux. The sharp upward trend in 2013-14 aligns with the aftermath of a global financial crisis, where governments worldwide grappled with economic uncertainties. The smoother curve of 2022-23, on the other hand, echoes a time of relative stability. This could be indicative of the government’s resilience in the face of global challenges, showcasing its capacity to steer the nation’s financial course through changing international tides.
A Glimpse into the Future
The graph, as a visual storyteller, hints at a trajectory that extends beyond its current scope. It’s a glimpse into a future where tax policies are likely to continue evolving in response to changing societal, economic, and technological paradigms. By tracing the lines of this graph, citizens can anticipate the government’s commitment to fostering a tax system that mirrors the nation’s values, aspirations, and the ever-evolving contours of progress.
In the intricate details and overarching trends portrayed by this graph, one witnesses not just the evolution of taxation but a larger narrative of a nation striving for equitable growth, responsive governance, and a brighter economic horizon. As this visual representation captures the collective journey from 2013-14 to 2022-23, it beckons us to contemplate the story it tells and the stories yet to unfold in the ever-shifting landscape of finance and policy.
In Conclusion
The graph, encapsulating a decade of fiscal evolution, unveils an intriguing story of change, progress, and a reshaped economic landscape. It speaks to the government’s commitment to crafting policies that empower individuals, foster economic growth, and embody the principles of fairness and inclusivity. Beyond the lines and percentages, the graph conveys a powerful message of a nation marching towards a more balanced and prosperous future.