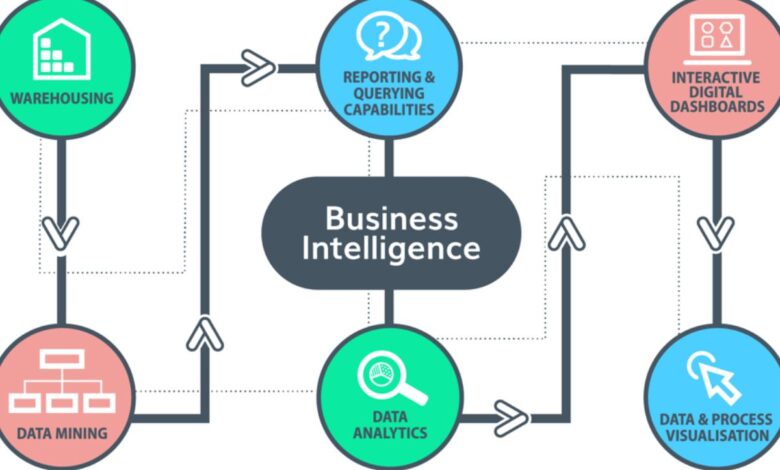
Understanding business intelligence tools begins with recognizing a fundamental challenge that organizations face today. Every business generates massive amounts of data through daily operations, customer interactions, sales transactions, and countless other activities. Think of this data as raw ore in a mine, it contains valuable insights, but those insights remain hidden until you extract and refine them. Business intelligence tools serve as the sophisticated machinery that transforms this raw data into actionable knowledge that drives better decisions.
Research reveals that ninety-one percent of business intelligence users report these tools significantly improve their decision-making capabilities, particularly for financial reporting and planning. Yet many professionals still find themselves opening dashboards expecting clarity but walking away with more questions, double-checking data before acting, or falling back on familiar spreadsheets just to feel confident. This gap between promise and reality often stems from selecting the wrong tool for your specific needs rather than any fundamental limitation of business intelligence itself.
This comprehensive exploration examines ten leading business intelligence tools that define the market in 2026, helping you understand not just what each platform offers, but when and why you would choose one over another. Think of this as learning to select the right tool from a craftsman’s workshop, each tool excels at specific tasks, and understanding those distinctions ensures you make informed choices for your organization.
1. Microsoft Power BI: The Accessible Gateway to Enterprise Analytics
Microsoft Power BI stands as the most widely adopted business intelligence platform in 2026, serving over six million active users globally. To understand Power BI’s appeal, consider how Microsoft designed it specifically to lower the barriers that traditionally separated business users from data insights. Rather than requiring extensive technical training or database expertise, Power BI presents familiar interfaces reminiscent of Excel that business professionals already understand, making the transition from spreadsheets to sophisticated analytics feel natural rather than overwhelming.
Following a significant pricing adjustment implemented in April 2025, the first major increase since the platform launched in 2015, Power BI Pro licenses now cost fourteen dollars per user monthly while Premium Per User subscriptions reach twenty-four dollars per user monthly. These increases reflect substantial platform enhancements including deep integration with Microsoft Fabric, Microsoft’s unified data analytics platform, and enhanced artificial intelligence capabilities through Copilot that help users create visualizations and insights using natural language queries.
Think about how Power BI works in practice. Imagine you manage sales operations and need to understand regional performance trends. With Power BI, you connect directly to your sales database, customer relationship management system, and Excel files containing additional context. The platform’s visual interface lets you drag sales figures onto a canvas, add geographic dimensions, and instantly see performance maps highlighting which regions excel and which require attention. Natural language features allow you to literally type questions like “show me last quarter’s sales by product category” and receive instant visual responses.
What makes Power BI particularly compelling for organizations already invested in Microsoft technologies is its seamless integration across the Microsoft ecosystem. Data flows naturally between Excel for detailed analysis, Teams for collaboration on insights, SharePoint for governed report distribution, and Azure for advanced data processing. For enterprises managing thousands of users across global operations, this integration eliminates the friction that occurs when disparate tools require constant data transfers and format conversions.
Power BI supports over one hundred data connectors spanning cloud services, on-premises databases, and specialty applications, ensuring you can analyze data regardless of where it resides. The platform scales from individual analysts exploring departmental data to enterprise deployments serving tens of thousands of users accessing massive datasets. Premium capacities provide dedicated computing resources ensuring consistent performance even under demanding analytical workloads, while built-in governance features help IT teams maintain security and compliance as analytics democratize across organizations.
2. Tableau: Visual Storytelling Meets Analytical Depth
Tableau has earned its reputation as the preeminent data visualization platform through relentless focus on making complex data comprehensible through stunning, interactive visual representations. Following its acquisition by Salesforce, Tableau has strengthened enterprise capabilities while maintaining the intuitive drag-and-drop interface that initially distinguished it from more technical alternatives. Current 2026 pricing positions Tableau Creator licenses at seventy-five dollars per user monthly when billed annually, providing complete authoring capabilities for building sophisticated visualizations and analytical applications.
Understanding Tableau requires appreciating how it approaches data differently than typical reporting tools. Rather than presenting static charts that simply display numbers, Tableau treats visualization as an exploratory conversation with your data. Consider a marketing analyst investigating campaign effectiveness. Tableau allows clicking on specific customer segments within a visualization to instantly filter all related charts, revealing how that segment behaves across channels, time periods, and product categories. This associative exploration often surfaces unexpected patterns that predetermined reports might miss entirely.
Tableau excels particularly in scenarios demanding rich data storytelling paired with analytical rigor. The platform provides extensive visualization types spanning traditional charts to advanced statistical graphics, geographic heat maps, and custom visualizations built through calculated fields and table calculations. Tableau’s calculation language balances accessibility for business users with depth for analysts comfortable with formulas, enabling sophisticated analyses like cohort analysis, basket analysis, and statistical modeling without requiring separate statistical software.
The tiered licensing structure acknowledges that different users require different capabilities. Tableau Explorer licenses at forty-two dollars per user monthly serve business users who primarily consume and interact with published dashboards, creating custom views and performing self-service exploration within governed data sources. Tableau Viewer licenses at fifteen dollars per user monthly accommodate casual consumers who primarily review dashboards with basic filtering and exporting capabilities, making it cost-effective to distribute insights broadly across organizations without licensing everyone as full creators.
One consideration when evaluating Tableau involves understanding that it assumes availability of clean, analysis-ready data. Industry research consistently indicates that analysts typically spend sixty to eighty percent of their time preparing data before Tableau can effectively visualize it. Organizations should either invest in complementary data preparation tools like Tableau Prep Builder, included with Creator licenses, or ensure data engineering teams provide well-structured analytical datasets. This preparation requirement reflects not a limitation of Tableau specifically but rather the reality that meaningful insights require quality inputs.

3. Qlik Sense: Associative Analytics for Unrestricted Exploration
Qlik Sense distinguishes itself through a unique associative analytics engine that fundamentally changes how users interact with data compared to query-based business intelligence platforms. Understanding this distinction illuminates why organizations might choose Qlik for specific analytical scenarios. Traditional business intelligence tools require users to navigate predefined hierarchies or construct specific queries to explore data. Think of this like following marked trails through a forest, you can reach designated viewpoints, but you’re constrained to predetermined paths.
Qlik’s associative model instead allows users to click any data point and instantly see how it relates to everything else in the dataset. The platform highlights associated values in green showing related data, white indicating unrelated information, and gray representing excluded values. This approach proves particularly valuable during exploratory analysis when you don’t necessarily know what questions to ask. Consider a supply chain analyst investigating cost overruns who clicks on a specific vendor and immediately sees which products, time periods, and locations associate with that vendor, plus which data points have no relationship, revealing patterns that might require multiple separate queries in traditional systems.
Qlik Sense leverages in-memory processing technology that loads entire datasets into system memory, enabling extremely fast query performance even when working with billions of records. This architecture makes Qlik particularly suitable for organizations managing large, complex datasets where traditional database queries might require minutes to complete. The platform’s data modeling capabilities through the Data Load Editor allow technical users to perform sophisticated data transformations, aggregations, and enrichment using scripting languages, creating optimized analytical models that balance flexibility with performance.
The platform supports flexible deployment options spanning cloud-hosted environments, on-premises installations, and hybrid configurations combining both approaches. This flexibility proves valuable for organizations operating under regulatory constraints requiring specific data residency or those transitioning gradually from legacy infrastructure toward cloud-native architectures. Qlik’s integration capabilities encompass hundreds of data sources including enterprise resource planning systems, customer relationship management platforms, cloud data warehouses, and operational databases, enabling comprehensive analytical environments that eliminate information silos.
Qlik’s emphasis on governed self-service analytics balances empowering business users with maintaining data quality and security. IT teams establish certified datasets, approved calculations, and governed data models while business users freely explore within those guardrails. This approach reduces bottlenecks where every analytical request requires IT intervention while preventing the chaos that occurs when uncontrolled self-service generates conflicting metrics and unreliable insights across departments.
4. Looker: Modeling-Driven Analytics from Google Cloud
Looker, now integrated within Google Cloud’s ecosystem, provides business intelligence distinguished by its modeling layer approach that ensures metric consistency across organizations. To understand why this matters, consider a common problem plaguing many companies. Different departments often calculate key metrics like customer lifetime value, churn rate, or profit margin using slightly different logic, leading to contradictory numbers in meetings where marketing reports one churn rate while finance reports another. These discrepancies undermine confidence in data-driven decisions because nobody knows which number reflects truth.
Looker solves this through LookML, a modeling language that creates centralized, version-controlled definitions for business metrics. Think of LookML as establishing a single source of truth where customer lifetime value gets defined once, incorporating all the nuanced business rules, and then every dashboard, report, or analysis referencing that metric uses the identical calculation. This consistency transforms data discussions from arguing about whose numbers are right to focusing on what the agreed-upon metrics reveal about business performance.
The platform’s git-based development workflow brings software engineering best practices into business intelligence. Changes to analytical content flow through version control with code reviews, testing environments, and controlled production deployments. This rigor proves particularly valuable in regulated industries where analytical accuracy carries compliance implications or in large organizations where hundreds of analysts might simultaneously develop content. You can track exactly when metrics changed, who made modifications, and easily roll back problematic updates that introduce errors.
Looker’s browser-based interface eliminates desktop software installations, allowing users to access analytical capabilities from any device with internet connectivity. The platform emphasizes embedded analytics scenarios where organizations integrate dashboards and visualizations directly into custom applications, extending analytical capabilities beyond traditional business intelligence consumers to operational users, customers, and partners. Integration with Google Cloud Platform services including BigQuery creates optimized performance for organizations standardized on Google’s cloud infrastructure, though Looker maintains connectivity supporting diverse data sources beyond the Google ecosystem.
Current pricing for Looker follows an enterprise model requiring direct sales engagement rather than published list prices, reflecting the platform’s positioning toward larger organizations with sophisticated analytical requirements. Organizations considering Looker should evaluate whether their analytical maturity and technical capabilities align with the platform’s modeling-centric approach. Teams lacking individuals comfortable with LookML may struggle initially, though many find the investment worthwhile given the long-term benefits of governed, consistent metrics.
5. Sisense: Embedded Intelligence for Complex Data Products
Sisense positions itself as an analytics platform specifically engineered for embedding sophisticated analytical capabilities directly into applications and workflows. To appreciate what this means, consider how traditional business intelligence focuses primarily on internal users, analysts, managers, and executives consuming dashboards to understand business performance. Embedded analytics instead integrates data visualizations and insights into products that customers use, operational applications that employees access daily, or partner portals that external stakeholders visit.
Understanding Sisense’s value proposition requires recognizing that it was architected from inception for multi-tenant scenarios where single platforms serve many distinct customer organizations, each accessing only their own data while the underlying infrastructure efficiently supports thousands of isolated environments. This architecture proves crucial for software-as-a-service companies building analytics into products, enterprises creating customer-facing portals with personalized insights, or organizations developing industry-specific applications requiring deep analytical capabilities.
The platform’s ElastiCube technology creates proprietary analytics databases optimizing query performance against large, complex datasets. Rather than loading entire data models into memory like some competitors, ElastiCubes intelligently bring only required columns and tables into memory for specific queries, balancing performance with resource efficiency. This selective approach enables Sisense to handle massive datasets that might overwhelm purely in-memory systems while maintaining responsive query times that users expect from modern analytical tools.

Sisense provides comprehensive white-labeling capabilities allowing organizations to completely customize analytical experiences with their own branding, color schemes, and user interface elements. End users interact with what appears to be native functionality within their applications rather than obviously third-party embedded content. The platform’s APIs and software development kits give developers granular control over how analytics integrate into surrounding applications, from subtle dashboard widgets to comprehensive analytical modules driving core application functionality.
Pricing for Sisense reflects its enterprise positioning, with costs typically starting around twenty-one thousand dollars annually for cloud deployments or ten thousand dollars for self-hosted installations, based on five users. Actual pricing scales significantly based on user counts, deployment configurations, and specific features required, with enterprise implementations commonly reaching well into six figures annually. Organizations evaluating Sisense should recognize it targets scenarios where embedded analytics drive significant business value, such as software products where analytical capabilities create competitive differentiation or internal applications where sophisticated insights directly impact operational efficiency.
6. Domo: Cloud-Native Business Command Centers
Domo offers a cloud-based business intelligence platform designed to function as a comprehensive business command center rather than simply an analytics tool. Understanding this distinction helps clarify when Domo makes sense versus more traditional business intelligence alternatives. While most business intelligence platforms focus primarily on data visualization and reporting, Domo extends into workflow automation, application building, and collaborative decision-making, creating an environment where insights directly trigger actions rather than simply informing them.
The platform emphasizes real-time dashboards providing leadership teams with current operational metrics without waiting for periodic report generation. Consider an executive dashboard displaying live metrics across sales performance, customer service levels, supply chain efficiency, and financial indicators, all updating continuously as underlying systems process transactions and activities. This immediacy transforms how leaders engage with data, shifting from reviewing yesterday’s performance to monitoring today’s operations and responding proactively to emerging situations.
Domo’s connector ecosystem supports integration with hundreds of data sources spanning cloud applications, on-premises databases, and file-based systems. What distinguishes Domo’s approach is that data integration often occurs without requiring separate extract, transform, and load tools or complex data engineering. The platform provides visual data flow builders allowing business users to create connections, apply transformations, and schedule refreshes using intuitive interfaces rather than writing code or managing complex integration pipelines.
The platform’s mobile-first design ensures that executives and business users access critical metrics from smartphones and tablets with interfaces specifically optimized for mobile consumption rather than simply shrinking desktop dashboards onto smaller screens. This mobile emphasis supports decision-making regardless of physical location, enabling leaders to monitor operations while traveling, respond to issues from anywhere, and maintain situational awareness without being tethered to office workstations.
Domo supports alerts and notifications configured to trigger when metrics exceed thresholds, exhibit unusual patterns, or meet specified conditions. These proactive notifications shift analytics from passive consumption toward active management, automatically surfacing situations requiring attention rather than relying on users to manually review dashboards hoping to notice problems. Organizations can configure sophisticated alert logic incorporating multiple conditions, time-based rules, and cascading notifications ensuring appropriate stakeholders receive relevant information.
7. Zoho Analytics: Comprehensive Capabilities at Accessible Prices
Zoho Analytics provides a self-service business intelligence platform combining extensive functionality with pricing that makes enterprise-grade analytics accessible to small and medium-sized businesses. Starting at twenty-four dollars monthly for entry-level plans, Zoho Analytics positions itself as the practical choice for organizations requiring sophisticated analytical capabilities but operating under budget constraints that make platforms like Tableau or Sisense financially prohibitive.
The platform supports data integration from hundreds of popular applications including Salesforce for customer relationship management, QuickBooks for accounting, Google Drive for document storage, Zendesk for customer service, HubSpot for marketing automation, and Mailchimp for email campaigns. This breadth enables small businesses to consolidate information from the diverse tools they use daily into unified analytical environments without extensive integration development or technical expertise.
Zoho’s artificial intelligence assistant Zia helps users augment data, predict future trends, and generate insights that might require advanced statistical expertise using traditional approaches. Think of Zia as having a data analyst available to answer questions about your data, perform sophisticated analyses, and create personalized reports based on natural language requests. This AI assistance democratizes advanced analytics, making capabilities previously requiring specialized skills accessible to business users comfortable simply describing what they want to understand.
What makes Zoho particularly interesting for certain use cases is its white-label support for embedded analytics. Organizations can completely customize analytical experiences with their own branding, allowing businesses to offer sophisticated analytics to their customers or partners while maintaining consistent brand identity. This embedded capability, typically associated with expensive enterprise platforms, becomes accessible at Zoho’s price points, creating opportunities for smaller software vendors or service providers to differentiate their offerings through analytical features.
The platform includes robust data visualization capabilities spanning diverse chart types, interactive dashboards, and customizable reporting frameworks. Zoho Analytics supports collaborative workflows enabling teams to share data stories, annotate visualizations, and coordinate around analytical findings. The fifteen-day free trial allows prospective users to evaluate capabilities using actual organizational data before financial commitment, reducing adoption risk for budget-conscious organizations comparing multiple platforms.
8. ThoughtSpot: Search-Driven Analytics for Business Questions
ThoughtSpot pioneered search-based analytics that fundamentally transforms how business users interact with data by eliminating the traditional barriers separating employees from insights. To understand ThoughtSpot’s innovation, consider how most business intelligence platforms require users to either navigate through predefined dashboards hoping to find relevant information or submit requests to analytics teams who then build custom reports. Both approaches create friction between questions and answers.
ThoughtSpot instead allows users to simply type questions in plain English and receive immediate analytical responses. Imagine a sales manager wondering how the Northeast region performed last quarter compared to the same period last year. Rather than navigating through dashboards or waiting for reports, they type that exact question and instantly receive visualizations showing the comparison along with relevant metrics and trends. This Google-like search experience makes analytics accessible to anyone comfortable asking questions, regardless of technical expertise or familiarity with data structures.
The platform maintains a dual approach supporting code-first workflows for data teams while remaining code-free for business users. Data engineers and analysts establish semantic layers defining how business terms map to underlying data structures, configure security policies governing data access, and optimize analytical models for performance. Business users then interact with these governed environments using natural language without ever seeing the technical complexity underneath, creating intuitive experiences that handle large, complex cloud data at scale.
ThoughtSpot’s artificial intelligence capabilities automatically surface anomalies, trends, and patterns that users might overlook when manually reviewing data. Rather than requiring users to know what questions to ask, the platform proactively delivers relevant information based on user interests, historical queries, and detected data patterns. This combination of search-driven exploration and AI-powered insights helps organizations transition from reactive reporting toward proactive intelligence.
The platform supports embedded analytics scenarios where organizations integrate ThoughtSpot’s search and visualization capabilities directly into custom applications. This embedding extends analytical access beyond traditional business intelligence consumers to operational users, customers, and partners who interact with data through familiar application interfaces rather than separate analytics tools. ThoughtSpot’s pricing follows an enterprise model requiring sales engagement, reflecting positioning toward mid-market and enterprise organizations with substantial user populations and sophisticated analytical requirements.
9. Oracle Analytics Cloud: Enterprise Intelligence with Augmented Capabilities
Oracle Analytics Cloud represents Oracle’s comprehensive business intelligence suite within its broader cloud services portfolio, distinguished particularly by augmented analytics capabilities leveraging machine learning to surface insights automatically. To understand Oracle’s positioning, recognize that the platform primarily targets organizations already invested in Oracle’s extensive application ecosystem including enterprise resource planning, human capital management, supply chain management, and customer experience systems.
What makes Oracle Analytics particularly interesting is its emphasis on mobile analytics that outperforms many competitors through natural language queries and innovative consumption models including podcast-style audio briefings. Imagine receiving your daily business briefing as an audio summary during your morning commute, with Oracle’s AI identifying key changes, notable trends, and important metrics requiring attention, all delivered conversationally without requiring visual screen interaction. This audio-first approach acknowledges that busy executives often consume information while multitasking.
The platform’s augmented analytics features automate pattern detection, anomaly identification, and predictive modeling, effectively democratizing advanced analytical techniques that previously required specialized data science expertise. When business users explore data, Oracle’s machine learning continuously analyzes patterns in the background, surfacing unexpected correlations, significant outliers, or emerging trends that warrant investigation. This automated intelligence helps organizations move beyond simple backward-looking reporting toward forward-looking insights.
Oracle Analytics supports both self-service analytics for empowered business users and governed analytics for IT-managed scenarios, accommodating organizational preferences regarding centralized control versus distributed analytical capabilities. The platform addresses data silos through comprehensive integration capabilities consolidating information from Oracle applications, third-party systems, cloud data warehouses, and on-premises databases into unified analytical environments ensuring complete visibility across business operations.
Enterprise-grade security, extensive compliance certifications spanning industries and geographies, and sophisticated governance capabilities make Oracle Analytics suitable for organizations operating under regulatory requirements in finance, healthcare, government, and other controlled sectors. The platform’s integration with Oracle Cloud Infrastructure provides scalable computing resources, automated backups, and disaster recovery capabilities supporting mission-critical analytical workloads.
10. SAP Analytics Cloud: Unified Planning and Performance Management
SAP Analytics Cloud provides an all-in-one software-as-a-service platform delivering comprehensive analytics functionality specifically designed for SAP business users. Built on the HANA in-memory database platform, the solution integrates analytics, planning, and predictive capabilities within a single environment, eliminating the fragmentation occurring when organizations deploy separate tools for historical analysis, forward planning, and forecasting.
Understanding SAP Analytics Cloud’s value proposition requires recognizing how it uniquely combines backward-looking business intelligence with forward-looking planning and performance management. Consider how traditional approaches separate these functions, analysts use business intelligence tools to understand what happened, planners use spreadsheets or dedicated planning tools to project what should happen, and the disconnect between these activities creates inefficiency and inconsistency.
SAP Analytics Cloud instead enables users to analyze historical performance, identify trends and patterns, and immediately translate findings into forward-looking plans without switching between disparate applications. A finance manager might analyze last year’s departmental spending, notice seasonal patterns and cost drivers, and directly incorporate those insights into next year’s budget within the same interface, maintaining context and improving planning accuracy through data-informed decision-making.
The platform’s embedded machine learning capabilities surface smart insights automatically, highlighting anomalies and patterns warranting attention. When reviewing financial reports, the system might flag unexpected variance between actual and planned spending in specific categories, automatically analyze contributing factors, and suggest potential explanations based on historical patterns and correlation analysis. This automated intelligence accelerates root cause analysis and focuses attention on situations requiring intervention.
SAP’s extensive industry-specific content and best practice templates accelerate deployment for organizations in manufacturing, retail, healthcare, financial services, and other sectors where SAP maintains deep domain expertise. Rather than building analytical frameworks from scratch, organizations can leverage pre-configured dashboards, reports, and planning models tailored to industry-specific processes and metrics, customizing them to match unique requirements rather than starting with blank canvases.
Selecting the Right Tool for Your Organization
Choosing optimal business intelligence tools requires moving beyond feature comparisons toward understanding how different platforms align with organizational context, technical capabilities, and strategic objectives. Think of this selection process like choosing the right vehicle, the best car for a small family differs dramatically from the optimal choice for a construction company, and neither selection reflects inherent superiority but rather fitness for specific purposes.
Organizations prioritizing ease of use and broad analytical democratization should examine platforms like ThoughtSpot with natural language interfaces or Power BI with familiar Microsoft-aligned experiences that minimize learning curves. These tools excel when your goal involves empowering hundreds or thousands of business users to explore data independently without extensive training or technical expertise. The intuitive interfaces lower adoption barriers while comprehensive governance ensures users explore data safely within appropriate boundaries.
Technically sophisticated teams comfortable with modeling languages and valuing metric consistency should consider Looker’s structured approach ensuring everyone uses identical calculation logic. While Looker demands more upfront investment establishing data models and semantic layers, this rigor pays dividends in large organizations where metric inconsistencies previously undermined confidence in analytical findings. The platform particularly suits environments where analytical accuracy carries compliance implications or where hundreds of analysts simultaneously develop content requiring coordination.
Organizations requiring embedded analytics capabilities should prioritize platforms like Sisense or Domo explicitly designed for integrating analytical features into applications and workflows. These tools provide the white-labeling capabilities, multi-tenant architectures, and developer-friendly APIs necessary for building analytical products rather than simply consuming internal business intelligence. The premium pricing reflects specialized capabilities supporting use cases where analytics create direct business value through product differentiation or operational integration.
Budget considerations naturally influence platform selection, though organizations should evaluate total cost of ownership encompassing not just licensing fees but also implementation expenses, training requirements, data preparation investments, and ongoing administration overhead. Platforms like Zoho Analytics provide accessible entry points for budget-conscious organizations, while enterprise solutions like Oracle Analytics Cloud or SAP Analytics Cloud justify premium pricing through comprehensive capabilities and deep integration with corresponding application ecosystems.
Most leading platforms offer free trials or limited-feature versions allowing hands-on evaluation before financial commitment. Organizations should leverage these opportunities to test platforms using representative datasets and actual business scenarios rather than relying exclusively on vendor demonstrations. Involving diverse stakeholders including business users, IT administrators, and executive sponsors during evaluation ensures selected platforms satisfy varied requirements across organizational hierarchies while building buy-in supporting successful adoption.

The business intelligence landscape in 2026 offers unprecedented choice spanning from accessible, affordable solutions democratizing analytics for small organizations to comprehensive enterprise platforms supporting complex analytical requirements at global scale. By thoughtfully evaluating organizational needs against platform capabilities, understanding not just what tools do but when and why different approaches prove optimal, businesses can identify intelligence solutions that enhance decision-making, optimize operations, and support strategic objectives. The right choice balances immediate functionality requirements with growth projections, ensuring selected platforms evolve alongside expanding analytical maturity without forcing disruptive migrations in future years.