Apple iPhones Supplier Foxconn’s Chairman Meets China’s Henan Officials Now
In his capacity as chairman, Liu will be visiting the largest Apple iPhone factory for the first time. According to the source, Liu's major objectives are to examine the situation following the start of production and to have a lengthy discussion.
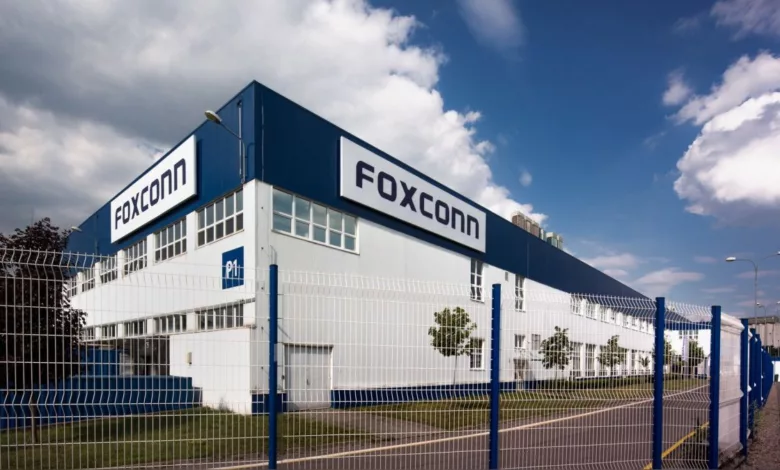
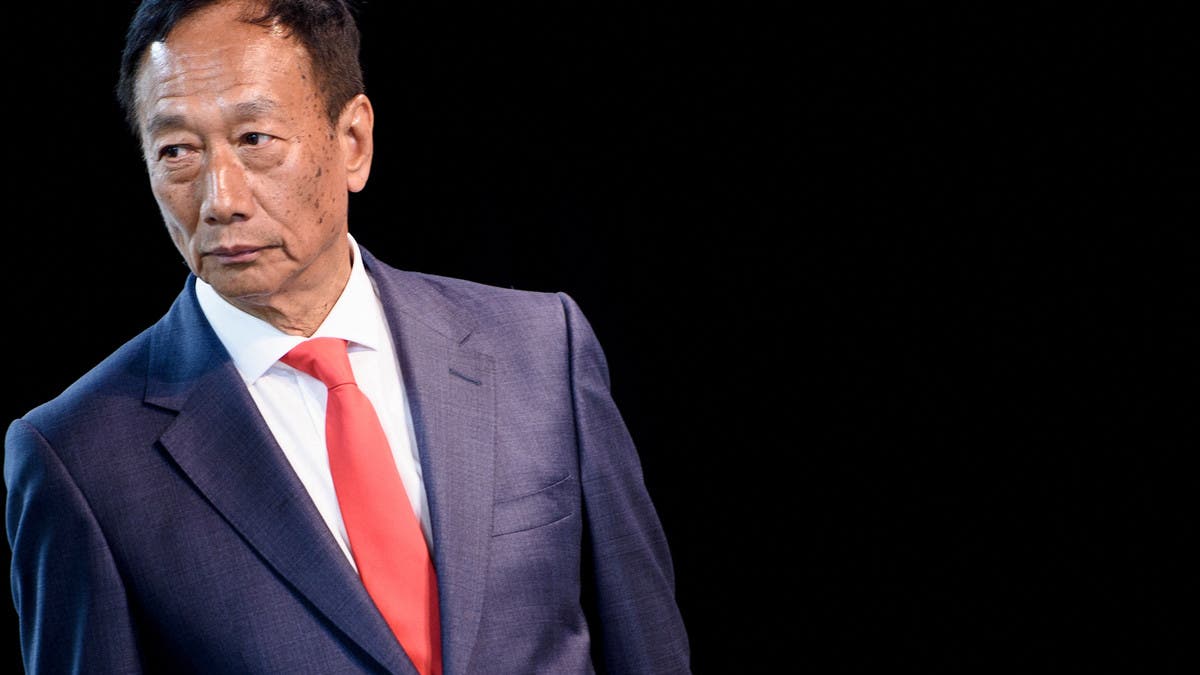
According to the sources, Foxconn Chairman Liu Young-way has gone for a four-day inspection of the company’s iPhone plant in Zhengzhou, China. In his capacity as chairman, Liu will be visiting the largest Apple iPhone factory for the first time. According to the source, Liu’s major objectives are to examine the situation following the start of production and to have a lengthy discussion.
The Communist Party chairman of the province where Zhengzhou is located, Lou Yangsheng, will be among the senior government officials with whom Liu will meet, according to the source. Hon Hai Precision Industries Co., formerly known as Foxconn, declined to comment. An inquiry for comments was not immediately answered by the Henan government. Because they were not authorized to speak to the media, the source who provided the information declined to be named.
A COVID-19 outbreak that occurred late last year disrupted production at the Taiwanese company’s iPhone manufacturing and resulted in the resignation of thousands of employees. Foxconn stated that production at its Zhengzhou plant had “essentially back to normal” in January.

Impact Of Covid On Apple iPhones
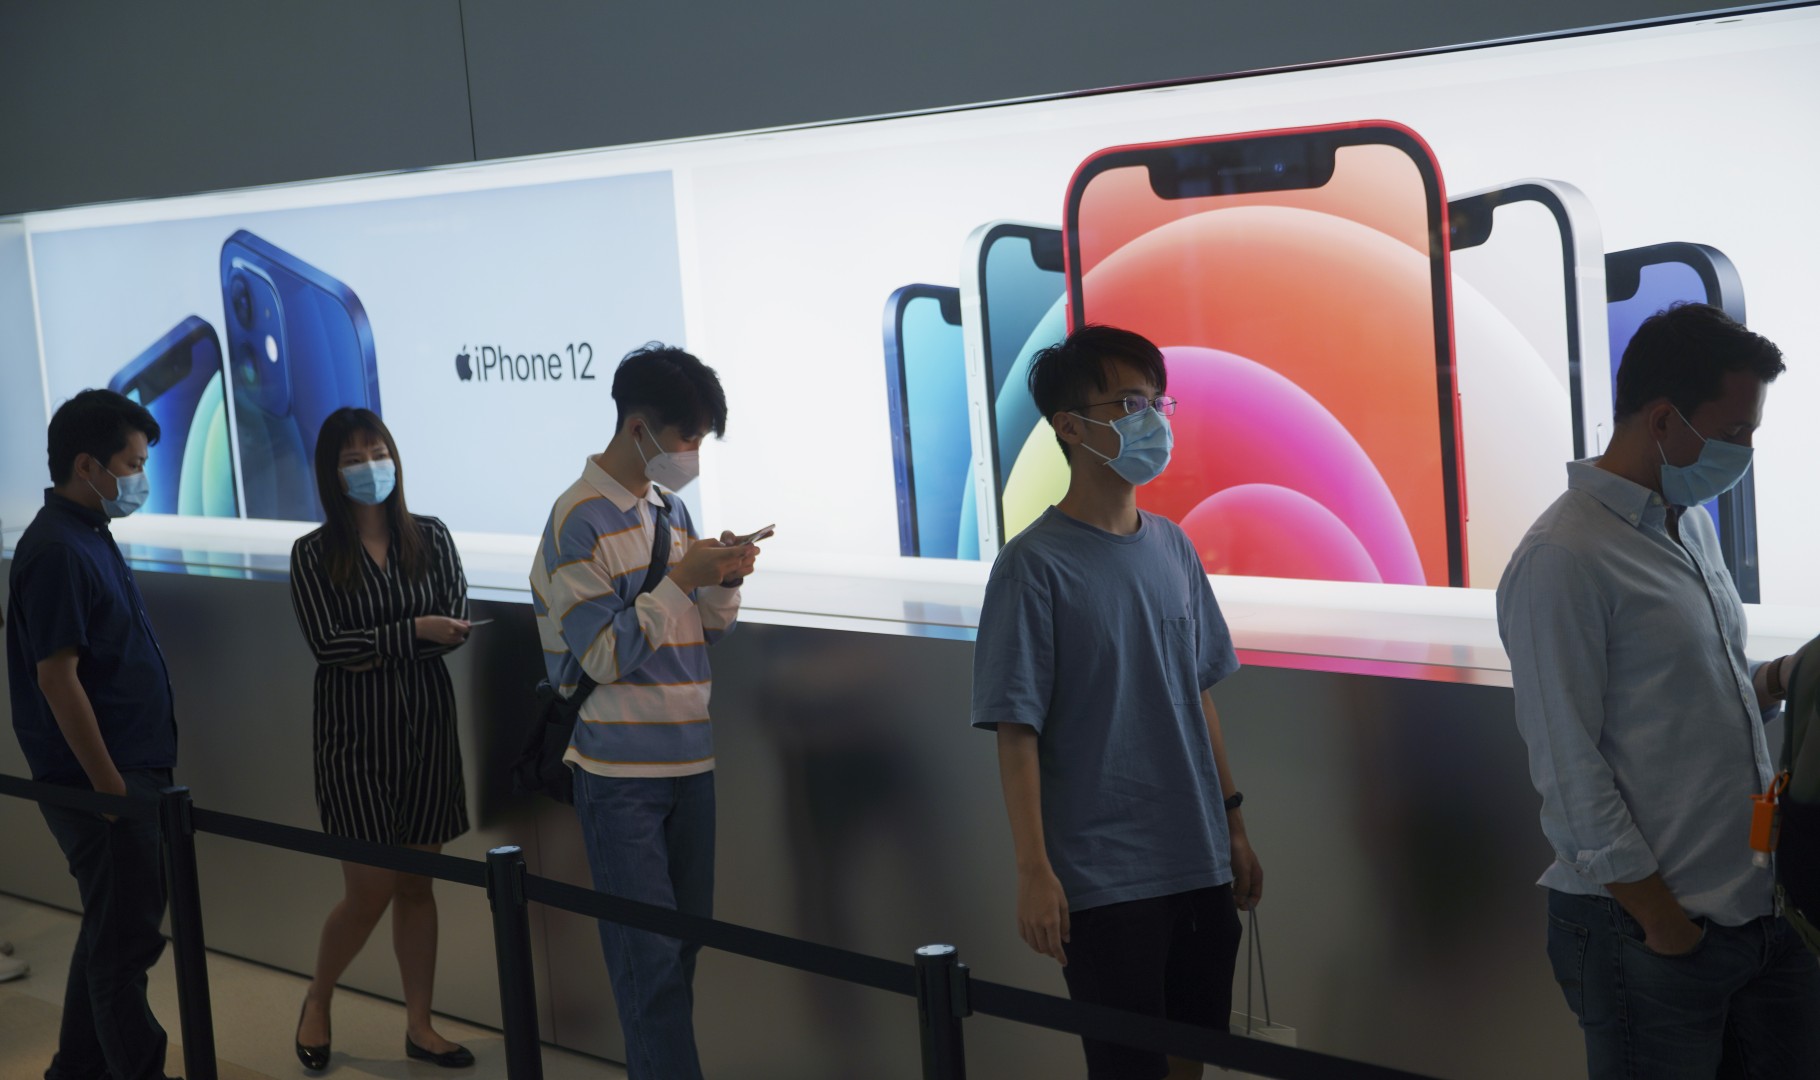
Apple iPhones’ quarterly revenue has been severely impacted by the ongoing Covid-19 lockdowns in China; the company estimates a loss in sales of up to $8 billion, with the Shanghai lockout playing a major role. China’s pandemic limitations may cause a further decline in Apple goods to demand when more cities there experience them.
“We have estimated the limits to be in the range of $4 to $8 billion, and these constraints are predominantly focused around the Shanghai corridor”, Apple CEO Tim Cook stated in an earnings call this week. According to Apple CFO Luca Maestri, “the COVID-related issues are also having some influence on client demand in China.” According to the research, Shanghai and the surrounding areas are home to more than half of Apple’s 200 primary suppliers.
The report stated that “the lockdowns and traffic restrictions impair a wide range of commercial activity in the region.” A shortage of silicon is affecting the whole industry, including the iPhone manufacturer, and will last through the current quarter. Cook did note that “almost all of the affected final assembly factories have now reopened,” though.
31 businesses operate production facilities in Shanghai that provide goods to Apple iPhones. Reports state that some Apple suppliers have reopened buildings with workers living on-site in conditions resembling bubbles. Foxconn, Apple’s top supplier, has continued to run its largest iPhone manufacturing plant in Zhengzhou, China. Chinese officials claim that almost all of the victims in the outbreak in Shanghai were older, unvaccinated citizens with underlying health issues.
China’s Apple iPhone Industry Rebounds
Foxconn, an Apple supplier, anticipated that its COVID-affected Zhengzhou plant in China would restart full production, according to a Foxconn source, after worker unrest last month disrupted the largest iPhone manufacturer in the world.
Later, the biggest manufacturer of contract electronics in the world said that production issues connected to COVID-19 restrictions at the main iPhone manufacturing caused revenue in November to decline 11.4% year over year. With November being the most affected month, the general pandemic situation has been brought under control, the firm said in a statement. It also said it had begun hiring new staff and was progressively “restoring production capacity to normal.”
According to Foxconn, a portion of shipments were affected by production disruptions in Zhengzhou in November, which contributed to a year-over-year fall in revenue for the company’s smart consumer electronics sector, which includes smartphones. Nothing more was provided.
The Zhengzhou mill has struggled with the severe COVID-19 requirements, which has fueled worker unhappiness with the working environment. Before the Christmas and Lunar New Year holidays in January, production of the Apple device was halted, and many employees were forced to either leave the company or isolate themselves to stop the virus from spreading.
Citing a source familiar with the situation, Foxconn could have seen more than 30% of the November output at the Zhengzhou factory disrupted by the turmoil in November, which saw workers fight with security personnel. Foxconn has not provided information on how the disruption has affected its financial situation or manufacturing schedule.
According to analysts, Foxconn assembles about 70% of iPhones; the majority of its premium models, like the iPhone 14 Pro, are produced in the Zhengzhou facility. With the employment of new employees underway, the individual with direct knowledge of the situation stated that “the capacity is currently being progressively resumed.” Given that the material was confidential, the person declined to be named.
Foxconn Opted Not To Respond
The business hopes to restore full production “as soon as feasible,” according to a second Foxconn source with knowledge of the situation, although she was unable to provide a timetable. Regarding the demonstrations and the government’s relaxation of COVID restrictions, the individual declared, “The situation has stabilized.” The neighborhood government is actively assisting with the restart.
The Taiwanese company stated last month that it anticipates considerable growth for cloud and network goods and a minor year-over-year reduction in fourth-quarter revenues for its smart consumer devices sector.
Without providing further details, Foxconn stated that it anticipated its overall revenue for the fourth quarter to be “approximately in line with the market consensus”. It did not provide a new perspective for any of its many business sectors. The business stated that its outlook for 2023 is quite cautious. Shares of Foxconn closed unchanged, in line with the 0.1% gain experienced by the overall market.
Effects Of China’s Dynamic Zero-Covid Policy On iPhone Manufacturing
There are no victors in China’s game of Whac-A-Mole, dubbed “dynamic zero-Covid” by the government, which has decimated the nation’s economy and brought growth to levels not seen in decades. This was never more obvious than when Zhengzhou’s largest iPhone manufacturing began imposing restrictions on staff, terrifying them to the point of a mass exodus.
The largest contract electronics manufacturer in the world, Foxconn, has previously experienced issues with coronaviruses. Yet this was the first time that Apple, the biggest technology business in the world, was feeling the devastating impact. The business predicted fewer shipments of the iPhone 14 Pro and 14 Pro Max than previously anticipated, and Foxconn reduced its fourth-quarter growth downward as well.
For those in China, Zero-Covid is nothing new. It has been a part of their lives for almost three years. But the most recent epidemic in the province of central Henan was particularly unappealing. Employees at Foxconn’s top iPhone manufacturing facility complained about appalling living conditions and a dread of becoming sick due to subpar medical care.
Workers report that things have changed in the last couple of weeks and that they now have access to medication while in quarantine. But following a mass exodus of employees, this happened. To retain assembly line workers as the US enters the busiest shopping period of the year before the holidays, Foxconn has been working hard. The business increased its daily cash bonus to 400 yuan (US$56) and offered a US$70 subsidy to entice some of its staff back.
Although being only one business, Foxconn is strategically significant to China because of its size and place in the electronics supply chains of the biggest tech brands in the world. At its height, the Zhengzhou facility alone employed close to 300,000 people.
The factory is an important local employer, so village cadres began contacting former workers to convince them to come back to work. Even People’s Liberation Army veterans were encouraged to work at the facility in one county by the regional veteran’s affairs office.
Many internet companies are hedging their bets, but for now, China is still too important to supply chains for them to abandon the region. Apple iPhone has already boosted production in India, while rivals like Samsung have long since started expanding their capacities in other areas, with Vietnam being one of the most well-liked choices.
Concern Of Apple iPhone’s CEO
The US$12 billion Taiwan Semiconductor Manufacturing Corporation factory is still under development, but Apple CEO Tim Cook announced that the business would be purchasing chips from a plant in Arizona. This information was released shortly after Apple announced it was abandoning plans to purchase memory chips from YMTC in China.
Mainland China has made progress in memory chip production, but its semiconductor factories are still unable to produce the sophisticated processors required to power an iPhone. YMTC was among the hardest hit when Washington strengthened export restrictions once more in October as the US considered blacklisting the company.
The struggles of the semiconductor industry show how the tech war and zero-Covid are harming the second-largest economy in the world, which was already shrinking before the outbreak. In October, the domestic chip sector experienced its biggest monthly decline ever, and in the first ten months of the year, the decline in chip imports intensified.
It is no accident that Shanghai, China’s semiconductor hub, experienced significant disruption earlier this year due to a lockdown of the whole city. The largest chip manufacturer in the nation, Semiconductor International Manufacturing Corporation, based in Shanghai, likewise predicted that US export restrictions will have an impact on fourth-quarter sales.

Lockdowns in Shanghai this year also affected Pegatron’s operations in mainland China. Pegatron is a Taiwanese company. Following rumors that its shipments had been delayed, potentially due to a labeling dispute, which the firm disputed, the company became embroiled in US-China hostilities.
Yet, China continues to dominate the world’s manufacturing industry. Beijing may anticipate that investment will resume once zero-Covid limitations are repealed, a day that is still far off, but geopolitical tensions won’t go so quickly. The trend of gradually diversifying supply chains away from China appears to be continuing, regardless of whether Apple, Samsung, or any other international company is carefully managing its brand.
On websites like microblogging site Weibo and TikTok’s Chinese equivalent Douyin, employees vented their rage by posting texts, pictures, and videos of chaotic events. Several expressed worry that incidents may have gone unreported, placing workers in danger of infection.
Edited by Prakriti Arora