The Poorest 10% In The US And Canada Earn More Than India’s Richest 10%. World Bank’s Inequality Figures Raise A Question About India’s Economic Success. Is India Really Shining?
India is racing towards global economic superpower status, armed with impressive GDP growth and billion-dollar ambitions. But a World Bank comparison raises an uncomfortable question: if even India's richest 10% fall behind the poorest 10% in the US and Canada on the reported daily measure, who exactly is benefiting from India's economic success?

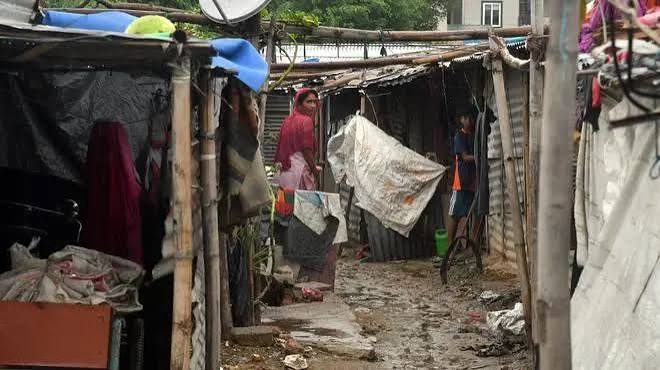
India’s economy is among the world’s fastest-growing, its GDP runs into hundreds of lakh crore rupees, and the country is increasingly presented as an economic power to watch. Yet a comparison drawn from the World Bank’s 2026 Poverty and Inequality Platform has thrown up an uncomfortable question: how far does India’s economic success translate into living standards for its people?
According to figures reported on October 12, the daily income or consumption threshold for India’s poorest 10% is around $3 per person. For the richest 10% in India, the corresponding figure is approximately $10. In comparison, the reported threshold for the poorest 10% is around $25 in the United States and $31 in Canada. Germany and Australia are at approximately $28.
The contrast is striking. The reported threshold for the poorest 10% in these advanced economies is higher than that for India’s richest 10%. It offers a glimpse of the gap in living standards between India and some of the world’s wealthiest economies, even before we begin examining the differences within India itself. World Bank data coverage
There is, however, an important distinction to make. These figures refer to income or consumption measured through household distributions, not necessarily salaries or wages. The World Bank’s Poverty and Inequality Platform uses survey-based distributions to estimate how income or consumption is spread across a population. The figures are also adjusted for purchasing-power differences, allowing comparisons across countries with very different price levels. World Bank’s percentile database
So here is a legitimate question.
—If India is growing so rapidly, how should that growth be measured against the living standards of its population?
—And what does the country’s economic success look like when the focus shifts from the size of the economy to the resources available to individual households?
To answer that, we first need to look at the numbers India itself uses to demonstrate its economic progress.
India’s Economic Success Story By The Numbers
There is little doubt that India has recorded substantial economic growth. According to the Ministry of Statistics and Programme Implementation, the country’s real GDP grew by an estimated 7.6% in the financial year 2025–26, while nominal GDP reached approximately ₹345.47 lakh crore. These are the ministry’s revised estimates published in 2026. MoSPI national accounts data
These figures matter. Real GDP growth measures the increase in economic output after accounting for price changes, while nominal GDP measures output at current prices. Sustained growth expands the economy’s capacity to produce goods and services, generate revenue and finance investment. It can support improvements in infrastructure, public services and employment, provided those gains translate into productive activity and better opportunities for households.
India’s expanding economy has also been accompanied by greater investment in infrastructure, wider use of digital payments and the growth of modern services. These are meaningful changes, and any assessment of India’s economic performance must recognise them.
But the size of an economy and the prosperity of its people are two different things.
GDP measures the value of goods and services produced across the country. It does not tell us how that output is distributed, how much an individual household earns, or how much money remains after essential expenses. A country can record impressive aggregate growth while large sections of its population continue to have limited purchasing power.
This is where GDP per capita, household consumption, wages and poverty data become essential. They help move the discussion beyond how much India produces to how much economic progress is reflected in people’s everyday lives.
The World Bank comparison does not cancel out India’s growth figures, just as GDP growth does not settle the question of inequality. The two measure different aspects of the economy.
The real test, therefore, is not simply whether India is growing. It is whether that growth is raising living standards across the income distribution and whether the benefits are reaching households that have the least room to absorb economic shocks.
Who Is Benefiting From India’s Growth?
If GDP tells us how much an economy produces, income and wealth distribution help explain who benefits from that production. And this is where India’s economic success story becomes more complicated.
A March 2024 study by the World Inequality Lab, titled Income and Wealth Inequality in India, 1922–2023: The Rise of the Billionaire Raj, estimated that India’s richest 1% accounted for 22.6% of national income and held 40.1% of the country’s wealth in 2022–23. The researchers said both shares had reached their highest levels in the period covered by their historical analysis. study
These are estimates produced by independent researchers, not official government figures. The distinction matters, particularly because measuring the incomes and assets of the wealthiest households is difficult when surveys do not capture the entire population equally well. Nevertheless, the study raises an important question about how the gains from India’s economic expansion are distributed.
Wealth and income are also different things. Income is money received over a period, while wealth includes accumulated assets such as property, shares and other investments, minus liabilities. Someone may have considerable wealth without earning a large regular income, while a salaried household may earn reasonably well without owning significant assets.
The government’s own consumption data offers another perspective. The Household Consumption Expenditure Survey for 2023–24 reported average monthly per-capita consumption expenditure of ₹4,122 in rural India and ₹6,996 in urban India, excluding the imputed value of free welfare benefits. The government also reported a decline in measured consumption inequality compared with the previous survey. MoSPI consumption survey
Both findings deserve attention. Falling consumption inequality can indicate that spending levels are becoming less unequal, even while estimates of wealth concentration remain high. The measures are not contradictory by definition: they capture different aspects of economic life.
The question, therefore, is not simply whether inequality is rising or falling. It is whether ordinary households are experiencing sustained improvements in their incomes, consumption and financial security as the economy expands. India’s GDP figures cannot answer that question on their own.
The Jobs And Wages Test
For most Indians, economic growth becomes meaningful through employment. A larger economy should ideally create more productive jobs, improve wages and give workers a greater degree of financial security. But the number of people employed does not tell us everything about the quality of that employment.
The government’s Periodic Labour Force Survey for 2025 provides a useful starting point. According to the annual report released in March 2026, the unemployment rate among people aged 15 and above was 3.1% in 2025, using the usual-status measure. Youth unemployment among those aged 15–29 stood at 9.9%, down from 10.3% in 2024. The report also recorded an increase in the share of workers in regular wage or salaried employment, from 22.4% in 2024 to 23.6% in 2025.
These figures offer reasons to recognise progress. But unemployment alone is an incomplete measure of labour-market conditions. A person working for a few hours, someone running a small business with irregular earnings and an employee receiving a stable monthly salary may all be classified as employed, despite having very different levels of financial security.
The share of self-employed workers also remains substantial. The same survey put it at 56.2% in 2025. Self-employment can represent entrepreneurship and independence, but it can also include people working in small, low-income activities because regular jobs are unavailable. The figure needs to be understood alongside earnings, working hours and the productivity of these activities.
Wages are equally important. If nominal earnings rise by 6% while the cost of living increases by a similar amount, the improvement in purchasing power is limited. That is why real wages – earnings adjusted for inflation – offer a more useful measure of whether workers are becoming better off.
India’s challenge is not merely to increase employment numbers. It is to create enough productive work for a vast workforce, improve earnings and expand access to secure jobs. The PLFS provides evidence of some improvements, but it must be read alongside wage data and the quality of work available.
Ultimately, the test of a growing economy is not just how many people are working. It is whether their work allows them to meet essential expenses, save for the future and improve their standard of living.
The Cost Of Living Versus The Money People Earn
Economic growth can look impressive on paper, but household prosperity is also determined by what people can afford. Food, rent, transport, education and healthcare compete for the same monthly income. When these expenses rise faster than earnings, families can find themselves working harder without feeling significantly better off.
India’s inflation figures offer an important measure of this pressure. Retail inflation rose to 5.54% in September 2026, according to data reported on October 12, while food inflation reached 7.74%. The increase brought inflation close to the Reserve Bank of India’s upper tolerance limit of 6%, with food prices contributing significantly to the rise. Reuters report
Inflation does not mean that every household experiences the same increase in expenses. Families that spend a larger share of their income on food can be particularly vulnerable when essential items become more expensive. Urban households may face substantial housing and transport costs, while rural families can be affected by food prices, agricultural incomes and irregular employment.
The crucial distinction is between nominal income and purchasing power. A salary increase does not necessarily make a household better off if essential expenses rise at the same time. Real income, which accounts for inflation, offers a more meaningful indication of whether people can afford more goods and services than before.
The government’s household consumption surveys provide another useful perspective by recording spending across rural and urban India. However, average expenditure does not reveal the full experience of every household, and spending alone cannot establish whether a family is financially secure.
The larger question is whether economic growth is translating into enough purchasing power for households to meet their needs, save money and deal with unexpected expenses. GDP growth can expand the country’s economic capacity, but household budgets show whether that expansion is improving everyday life.
Poverty May Be Falling, But How Secure Are Households?
India has made measurable progress in reducing poverty, and that progress must form part of any fair assessment of its economy. The government has highlighted estimates from NITI Aayog suggesting that 24.82 crore people moved out of multidimensional poverty between 2013–14 and 2022–23. The estimate draws on indicators covering areas such as health, education and living standards, rather than income alone. NITI Aayog and government release
Multidimensional poverty is important because deprivation cannot be measured solely by how much money a person earns. Access to sanitation, electricity, schooling, nutrition and other basic services can improve even when household incomes remain modest. Progress in these areas represents a real improvement in living conditions.
Yet multidimensional poverty and monetary poverty are different measures. A household may gain access to electricity, sanitation or a government welfare scheme and no longer face certain forms of deprivation, while still struggling to afford nutritious food, private healthcare or higher education. Likewise, moving above a monetary poverty threshold does not necessarily mean a family has enough savings to withstand a prolonged loss of income.
Healthcare illustrates the problem. According to the National Health Accounts for 2021–22, out-of-pocket spending accounted for 39.4% of India’s total health expenditure. That share had declined considerably from earlier years, while the government’s share of total health expenditure had increased to 48%. These are significant improvements, but households still bear a substantial part of the country’s healthcare costs.
For a family with limited savings, an illness can mean borrowing money, postponing treatment or cutting expenditure elsewhere. The same vulnerability applies when a worker loses a job or an agricultural household suffers a poor harvest.
This is why poverty reduction and economic security need to be examined together. India can make genuine progress in basic living conditions while still facing the challenge of ensuring that households have stable incomes, affordable essential services and enough financial resilience to withstand unexpected shocks.
Can India’s Growth Create Prosperity On A Wider Scale?
India’s long-term economic prospects depend not just on how quickly its GDP expands, but on the kind of growth it generates. Manufacturing, exports and productivity are particularly important because they can create productive employment, raise earnings and help businesses compete internationally.
India has made substantial investments in roads, railways, ports and digital infrastructure. These can reduce the cost of doing business, improve connectivity and support the expansion of industries. The country’s services sector, particularly information technology and business services, has also established a significant presence in global markets.
But the challenge is to translate these gains into opportunities across a much wider section of the workforce. High-value services can generate substantial output without necessarily employing the same proportion of workers as labour-intensive manufacturing. Meanwhile, smaller businesses often face constraints involving access to finance, technology, skills and larger markets.
Manufacturing is therefore an important part of the equation. A stronger industrial base can create jobs for workers with different levels of education and experience, while supporting supply chains and local businesses. Yet expanding production alone is not enough. The jobs created must offer reasonable earnings, and productivity improvements must translate into better wages and working conditions.
Education and healthcare also matter to this equation. A workforce with stronger skills and better health is more productive, while accessible public services can reduce the financial burden on households. Economic growth becomes more widely beneficial when people have the capabilities and opportunities to participate in it.
India’s progress in infrastructure, digital access and services should not be dismissed. The question is whether these advances can support a pattern of growth that delivers rising productivity, secure employment and higher real incomes across the population.
The World Bank comparison that opened this article cannot, by itself, answer that question. But it provides a reason to look beyond the headline growth rate and examine the distribution of the benefits.
The Last Bit, Is India Really Shining?
India’s economic progress is real in several respects. The country has sustained strong growth, expanded infrastructure, increased access to basic services and made progress in reducing measured poverty. These achievements matter, particularly in a country of India’s size and diversity.
But they do not settle the question of whether the benefits of growth are reaching people evenly. GDP measures the size of the economy, not the financial security of individual households. Poverty estimates tell us how many people cross particular thresholds, but not necessarily whether they can withstand an unexpected expense. Employment figures show how many people work, but not always whether their earnings provide a secure livelihood.
That is why the World Bank figures reported at the centre of this article deserve attention. Their precise meaning depends on the underlying income or consumption measure, the reference year and the purchasing-power adjustments used. They point towards a larger question about the distance between India’s economic ambitions and the resources available to its people.
The answer cannot be reduced to declaring India either a success or a failure. A growing economy can deliver genuine improvements while leaving serious gaps in wages, opportunities and access to essential services.
The more meaningful test of India’s economic success is whether growth consistently improves the lives of people across the income distribution. That means better jobs, rising real earnings, affordable healthcare and education, and households with enough financial security to plan for the future.
India may be shining in terms of economic scale and global standing. Whether that prosperity is reaching enough of its people is a separate question — and one that GDP growth alone cannot answer.