
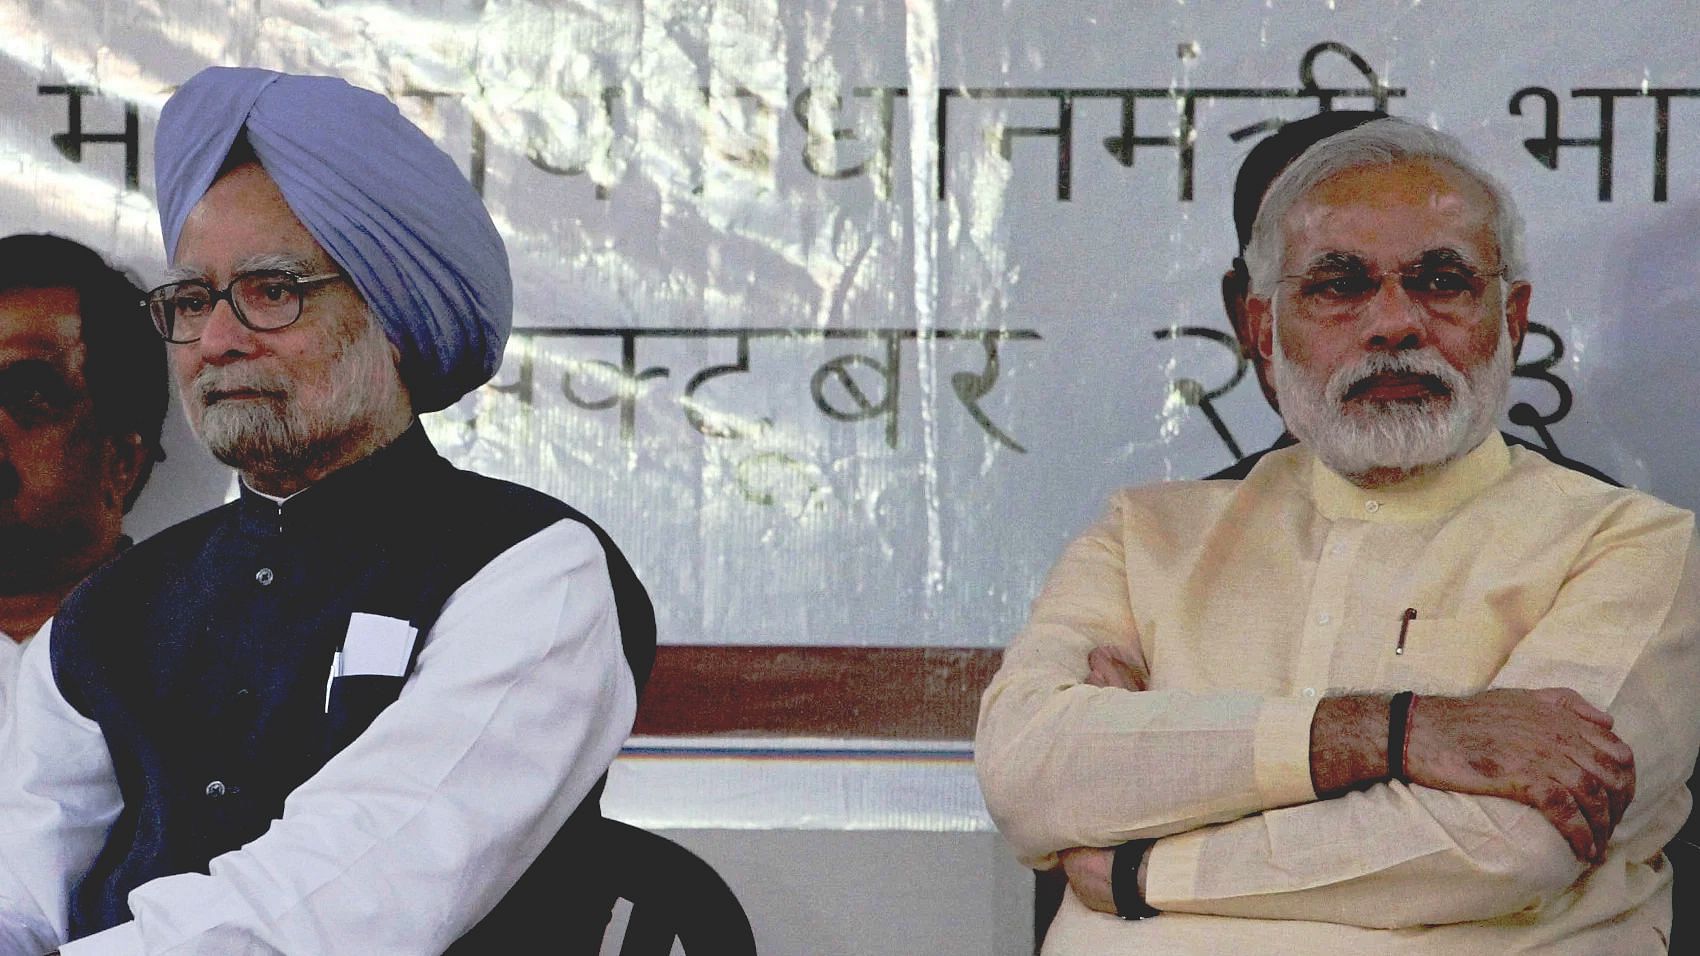
PM Narendra Modi’s 8 Years: How He has Performed compared to Manmohan Singh.
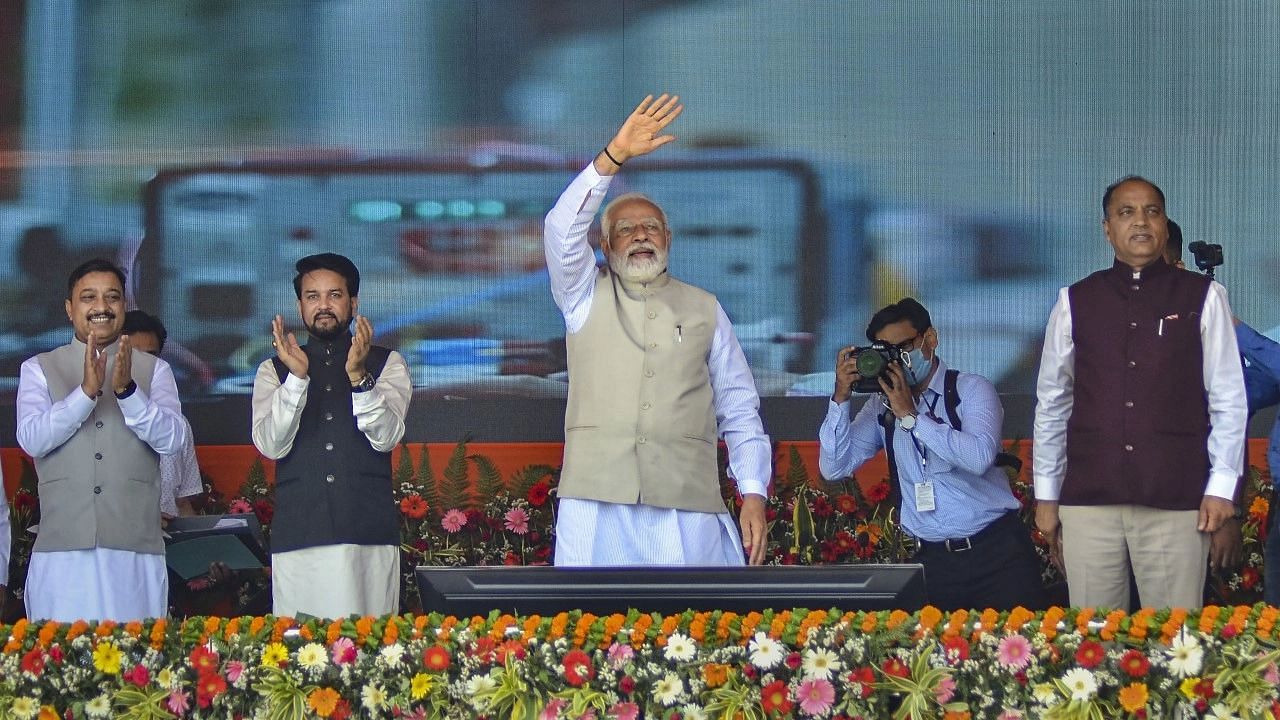
On May 30, 2022, the Bharatiya Janata Party (BJP) government, formed by Prime Minister Narendra Modi (NaMo), will celebrate its seventh anniversary. This was at a time when India was confronted with serious economic issues, including rising inflation and unemployment, agricultural hardship, and sluggish economic growth as compared to the time when Manmohan Singh was the Prime Minister. Year-to-date (YTD), the equity markets have dropped over 6%, while the Rupee has devalued by around 4%.
Due to the epidemic, no celebration was held to honor the anniversary last year, but the BJP has made extensive arrangements to do it this year. On the economic front, how does Narendra Modi (NaMo) contrast with former Prime Minister Manmohan Singh?
While Manmohan Singh dealt with the global financial crisis of 2008, Narendra Modi is dealing with the consequences of the COVID-19 outbreak.
Except for the odd years, 2020-21 and 2021-22, Modi’s GDP growth improved to 6.84 percent, slightly lower than Manmohan Singh’s.
However, under NaMo’s tenure, the average FDI was twice that of Manmohan Singh’s.The Rupee has devalued by about 19 percent during Modi’s tenure, falling from Rs 59 to a dollar to Rs 77-78 now.
It’s difficult to prefer one prime minister based on economic success because the circumstances differed throughout Singh’s and Modi’s terms.
Demonetization affected a substantial chunk of the informal sector, which accounts for a substantial chunk of the Indian economy, hard in 2016-17. So, how did the economy grow at an annual rate of 8.2 percent?
Between 2009-10 and 2013-14, when Manmohan Singh was Prime Minister, the Indian economy grew by 6.7 percent each year. Between 2014-15 and 2018-19, the economy of India was predicted to grow at a 7.5 percent annual rate. Narendra Modi was the Prime Minister of India at the time (from May 26, 2014, onwards).
As a result, the Modi government has seen faster economic growth than in the Manmohan Singh era. But the main question is: Does it pass the smell test? One way to figure this out is to look at actual economic indicators that reflect the average Indian’s financial actions.
Since January 2015, when India implemented a new method of measuring GDP, the country’s growth rate has been out of step with elevated economic indicators that represent individual financial decisions. From local vehicle sales to steel production, the economic data used here are real data (excluding inflation), not theoretical constructions, unlike GDP growth. So, if traditional car sales are increasing, it indicates that urban consumer demand is strong. If steel output increases, it indicates a robust automobile sector that consumes a lot of steel and improved physical infrastructures that individuals can use.
Lower GDP than during the Manmohan Singh era
The growth rate averaged 7.03 percent during Manmohan Singh’s first eight years in office, compared to 5.25 percent under NaMo’s, which was negatively impacted by the COVID-19 pandemic for two years. The Indian GDP shrank by 7.3 percent in the lockdown year of 2020-21.
Except for the odd years, 2020-21 and 2021-22, GDP growth under NaMo’s tenure was 6.84 percent, somewhat lower than Manmohan Singh’s.
In 2014, the rise in prices was a campaign issue.
During NaMo’s tenure, average inflation was 2.6 percent lower than during Manmohan Singh’s. Although, in this case, the reduced crude prices have aided a little. The rise in prices was a big problem in the 2014 general elections, and the BJP’s commitment to bring it under control was a crucial platform promise.
Following the Russia-Ukraine conflict, inflation has risen to 7% this year. It has compelled the government to lower gasoline and LPG cylinder costs to help the poor.
Unemployment has risen sharply.
The jobless rate was close to 5.6 percent in April 2012, the eighth year of Manmohan Singh’s presidency. Due to COVID-19-induced lockdowns and job losses, it has risen to 7.83 percent in April 2022, the ninth year of NaMo.
FDI, on the other hand, has more than doubled.
Due to the opening up of numerous industries under the Narendra Modi regime, such as retail, air transport, military, insurance, construction, and others, India has become one of the most popular FDI destinations (Top 10) in the world. The average FDI under NaMo’s tenure is more than double that of Manmohan Singh’s.
While worldwide flows fell in the last two years due to the economic consequences of COVID-19, India’s annual foreign investment reached an all-time high of $83.57 billion in 2021-22.
Was the market in Manmohan’s time better?
The Nifty50 returned roughly 15.5 percent per year during Manmohan Singh’s first eight years in power. During NaMo’s reign, this has dropped to 10.5 percent per year. The low base effect played a role during Singh’s tenure, as Nifty50 was only seven years old when he took office.
Some would say that the market has been rising since NaMo was announced as the NDA’s Prime Ministerial candidate in September 2013. When this is considered, the stock returns during NaMo’s reign rise to 12.5 percent a year.
(1) Local two-wheeler sales: Motorcycle sales increased by 12.44 percent each year in the Manmohan Singh tenure. During Modi’s tenure, the economy grew at a rate of 5.35 percent per year. Scooter sales increased by 25.7 percent every year during Singh’s tenure. During Modi’s tenure, the rate of change was 13.21% each year. Urban India sells more scooters than rural India. Motorcycles are popular in both urban and rural India. Motorcycle sales grew at a 5.35 percent annual rate during the Modi years, indicating agricultural suffering and, as a result, a gradual rise in rural India’s consumer power.
(2) Traditional car sales: Because no one forces someone to acquire a car, car sales are an important measure of how urban India feels about its economy. When a person buys a car (or a 2, for that issue), they have the confidence to put down a deposit and pay an equivalent monthly amount on a loan. During the Modi years, car sales climbed at a rate of 4.42 percent per year, compared to 7.92 percent during the Manmohan decades. The most notable increases were during the Manmohan Singh years, when car sales grew by 25.22 percent in 2009-10 and 29.08 percent in 2010-11, respectively.
(3) Additive consumer finance growth: This reflects how a sizable portion of the public views their economic prospects. People typically take out loans when they are confident in their ability to repay them. This may not be true for industry loans, but it is true for lending (i.e., housing loans, vehicle loans, and so on), given that the worrisome loan rate for retail loans is merely 2%. Loans that have not been returned for 90 days or longer are considered bad loans.
Bank retail loans are predicted to expand at 19.92 percent per year during the Modi period, compared to 22.47 percent per year during the Manmohan era.
(4) Air carrier traffic: This is one statistic that everyone who believes the Modi administration has done well on the financial front always brings up. Airline passengers increased by 9.20 percent each year during the Manmohan years. During the Modi years, it is predicted to expand at a rate of 15.28 percent each year.
(5) Indian Railways’ Passenger Revenues: People often overlook the fact that the development in air transport has occurred at the expense of people switching from Indian Railways travel. The growth of Indian Railways‘ passenger income has slowed due to this. This was 10.81 percent each year throughout the Manmohan years. During the Modi years, it is predicted to grow at a rate of 7.32 percent per year.
(6) Usage of steel production: Steel demand is another great predictor of the country’s investment climate, as steel is required to develop any new infrastructure. And improved infrastructure largely leads to improvement in people’s quality of life. Consumption of finished steel is predicted to rise 5.18 percent per year during the Modi period, compared to 7.18 percent per year during the Manmohan era, according to statistics from the India Brand Equity Foundation, a trust founded by the ministry of commerce and industry.
This reflects the reality that India’s investment climate remains uninteresting. A bleak investment outlook indicates that not enough jobs are being generated. It also implies that individuals who already have work see their wages rise at a slower rate.
(7) Taxation growth: This is an excellent measure of whether or not the income of people who work in the formal economy is increasing. Over the years, the Modi administration makes much of the improvements in income tax collection. During the Modi years, income tax collections are predicted to climb by 16.85 percent every year.
In comparison, during the Manmohan years, tax income grew at a rate of 17.53 percent every year. In comparison, during the Manmohan years, tax income grew at a rate of 17.53 percent every year. According to the government, more Americans are submitting tax filings now than ever before. While this is true, it hasn’t translated into a greater rate of tax revenue increase.
(8) Petroleum product usage: Fuel consumption tends to increase more quickly in a growing economy. During the Modi years, gasoline consumption is predicted to expand at 5.91 percent per year, compared to 3.47 percent during the Manmohan years. This is just another economic metric that has performed better under Modi than under Manmohan. This is just another economic metric that has performed better under Modi than under Manmohan. The fact that oil prices were substantially higher between 2011 and 2014 than ever since then is a straightforward explanation.
(9) Pricing: One of the Modi government’s true triumphs has been in the area of inflation. According to the price index (CPI), when Narendra Modi became Prime Minister in May 2014, inflation was 7.72 percent, including inflationary food pressures at 9.21 percent, according to the price index (CPI). Inflation was 2.57 percent in February 2019, with food costs declining by 0.66 percent. Food costs increased by only 0.13 percent in 2018-2019.
(10) Family income savings: This metric shows how much money people put aside. The issue here is that data is only available from 2011-12 forward, which is what we’ll look at. The gross family financial savings expanded at a rate of 13% per year when Manmohan Singh was Prime Minister.
They grew by 11.94 percent each year during the Narendra Modi years (up to 2017-18). In the Manmohan years, net family financial savings (gross family financial savings minus household financial liabilities) rose at 13.79 percent each year. During the Modi years, they grew at a rate of 7.38 percent every year (up to 2016-17).
(11) Commercial and domestic vehicle sales: Strong consumer demand should increase investment, with businesses growing to meet the need. Examining domestic and commercial car sales is a good technique to see if this is the case or not. Faster sales suggest increased activity in the infrastructure and industrial shows, which benefits individuals in the long run. Vehicles are being used to transport both finished and semi-finished products. During the Modi years, commercial vehicle sales increased at a rate of 9.74 percent per year.
They had increased at 10.50 percent every year throughout the Manmohan years. In truth, commercial vehicle sales increased significantly throughout the Modi years, albeit at a slower rate than during the Manmohan years. This is primarily due to the Modi government’s road-building program
(12). Tractor sales in the United States: This is an excellent predictor of how wealthy farmers feel about their financial situation. During the Modi years, tractor sales are predicted to expand at 4.49 percent per year. On the other hand, Tractor sales increased by 15.73 percent each year over the Manmohan years.
This demonstrates the presence of economic distress that harmed peasants during the Modi administration. In 2013-14, 634,000 tractors were sold in the United States. Over the next two years, sales decreased, reaching 494,000 in 2015-16. They have since rebounded to 724,000 between April 2018 and February 2019.
(13) Cement output: During the Modi years, cement production is predicted to expand at a rate of 4.32 percent per year, compared to 7.05 percent per year during the Manmohan era. Cement consumption grew slowly during the Modi years despite a huge road-building initiative.
This basically means two things. To begin with, private-sector investment has been sluggish. Second, the housing industry, which relies heavily on cement, has struggled. People aren’t buying new houses any longer. Surprisingly, once people leave agriculture, they tend to gravitate toward real estate and construction, partly because both industries offer many low-skill jobs. The lack of low-skilled jobs in India is reflected in the slow rise of cement manufacturing.
(14) Usage of steel: Steel demand is another great predictor of the country’s investment climate, as steel is required to develop any new infrastructure. And stronger infrastructure basically leads to improvement in people’s quality of life. Consumption of finished steel is predicted to rise 5.18 percent per year during the Modi period, compared to 7.18 percent per year during the Manmohan era, according to statistics from the India Brand Equity Foundation, a foundation founded by the ministry of commerce and industry.
This reflects the reality that India’s investment climate remains uninteresting. A bleak investment outlook essentially means that not enough jobs are being generated. It also implies that individuals who already have work are seeing their wages rise at a slower rate.
(15) Prices: One of the Modi government’s true triumphs has been in the area of inflation. According to the consumer price index (CPI), when Narendra Modi became Prime Minister in May 2014, inflation was 7.72 percent, with food inflation at 9.21 percent, according to the consumer price index (CPI). Inflation was 2.57 percent in February 2019, with food costs declining by 0.66 percent. Food costs increased by only 0.13 percent in 2018-2019.
Currency depreciation
The Rupee devalued by roughly 22% against the US dollar during Singh’s first eight years in office, from Rs 45 to a dollar to Rs 55. The currency has fallen by about 32 percent under NaMo’s reign, from Rs 59 to a dollar to Rs 77-78 levels today.
Aatmanirbhar Bharat, Exports, and Imports

During NaMo’s tenure, the country’s economy has been hampered by increased protectionism and a worldwide economic recession. The COVID-19 outbreak has hampered trade even further. Exports increased dramatically under Singh’s leadership, with the services sector leading the way.
The speed of expansion of imports has slowed under NaMo, owing to the ‘Aatmanirbhar Bharat’ initiative and the drop in crude oil prices. As a result, the trade imbalance in 2021-22 will be lower than in 2013-14.
India’s Trade Has Increased Significantly
Because of structural changes such as the Finance Act, 2016 (IBC) and the Goods and Services Tax, our EODB ranking has risen 69 places from 132 in 2011 under Singh to 63 under NaMo. From 2021 forward, the World Bank will no longer publish this report.
Our foreign exchange reserves have virtually doubled since Singh’s departure, from $300 billion at the conclusion of his term to close to $600 billion now.
Infrastructure construction is a unique shining beacon.
Mr. Modi’s government has been laying 36km (22 miles) of roads per day on average, as per Vinayak Chatterjee, co-founder of construction company Feedback Infra, compared to his predecessor’s daily total of 8-11km. Renewables (solar and wind) have doubled in the previous five years. With a current capacity of roughly 100 gigawatts, India is on course to fulfill its 2023 goal of 175 gigawatts.
Mr. Modi’s populist hallmark projects, such as millions of new toilets to curb open defecation, home loans, subsidized cooking gas, and water supply for the poor, were overwhelmingly praised by economists.
However, many of the toilets aren’t utilized or don’t have running water, and higher fuel prices have negated the subsidy’s advantage. Economists are concerned about India’s growing budget deficit as a result of higher spending without corresponding revenue from taxes or exports.
To summarise, it’s difficult to prefer one prime minister above the other based on economic success because the environment was distinct during their respective terms. While Singh had to deal with the international economic meltdown in 2008, Modi is dealing with the consequences of the COVID-19 pandemic.
What Would Modi’s Legacy Be?
The Modi juggernaut keeps rolling despite the economic turmoil, as indicated by the BJP’s victory in four out of five assembly elections earlier this year. It suggests that people are thankful for his government’s attempts to mitigate the effects of the epidemic and believe Modi is the best person to address the economic difficulties.
From here on out, Modi’s ability to steer an economic recovery and prosperity will determine who leaves a lasting legacy.
To evaluate performance on this front, we used three critical indicators: One, the average annual person-days generated under MGNREGA during the first five years since the program began under the UPA in 2006-07 to 2010-11, which was 200 crores, and improved to 230 crores under the Modi government; two, the average annual number of residences completed under the Indira Awaas Yojana and PM Awaas Yojana-Gramin, which increased from 21 lakhs to 30 lakhs per annum; and three, open defect. This is truly admirable. The Modi government attained ODF status by putting toilets ahead of temples, which had not been done in the 67 years of independence.

Overall, it is apparent that the Modi administration has underperformed in terms of GDP. However, its agri-GDP performance compares favorably to the UPA’s seven years in power. It has unquestionably improved its infrastructure and welfare programs, from energy production to roads and MGNREGA jobs to dwellings and toilets for the poor.
Although one may argue that these figures should be adjusted to include individuals living below the poverty line or any other deflator, I believe the Modi government has been more welfare-oriented than reforming to boost GDP development. It’s unclear how long this benefit approach can be sustained without increasing the size of the GDP pie.
One can only expect that once Covid-19 is under control, the government will be able to focus on growth initiatives, and India will recover. Surprisingly, the Sensex has been soaring despite the pessimism, rejecting even the RBI‘s warning of a likely bubble implosion. In the meantime, during the remaining time of the Modi administration, officials must stimulate demand, encourage MSME, and invest in rural health and agri-infrastructure.
edited and proofread by nikita sharma