Inequality: 2021 Report says India has a rich-poor divide
According to the latest World Inequality Report, India is categorized as a poor and unequal country, with the bottom 50% owning only 13% of the nation’s income and the top 10% claiming 57% by 2021. A detailed analysis follows.
According to the World Inequality Report 2022, according to India, which is “poor and very unequal, with an affluent elite,” the top 10% hold 57% of total national income, 22% of which is owned by the top 1%, with the bottom half holding 13%.
Moreover, the report also shows an income decline in 2020, with nearly half of this loss occurring in rich countries and half in low- and emerging-income countries. A large part of this is attributed to “South and Southeast Asia, and more specifically to India.”
In addition to Lucas Chancel and Thomas Piketty, this report was authored by Emmanuel Saez, Gabriel Zucman, and Gabriel Saez, who are all economists.
The report declares that India is a poor and unequal country with a wealthy elite. Compared with the top 10% and 1% who own 65% (Rs 63,54,070) and 33% (Rs 3,24,49,360), India’s middle class is relatively poor with an average wealth of Rs 7,23,930, or 29.5% of nation’s income.
There are 9,83,010 households in India, with the bottom 50% owning only 66,280 rupees or 6%. 2021 will bring an average annual national income of Rs 2,04,200 for the Indian adult population.
According to the report, the bottom half earned Rs 53,610, while the top ten per cent earned more than 20 times (Rs 11,66,520).
Since 2014, the proportion of the top 10% and bottom 50% in pre-tax national income has remained the same. According to the report, the quality of the government’s data on inequality has seriously deteriorated, making it particularly difficult to assess recent increases in inequality.
In India, one out of four people is multidimensionally poor, according to the Multi-dimensional Poverty Index recently prepared by Niti Aayog. Bihar has the highest proportion (51.91%). Jharkhand (42.16%) and Uttar Pradesh (37.79%) come in second and third, respectively.
Pandemic impact to inequality
The pandemic had a significant impact on India’s income, which declined due to the pandemic. It appears that the global share of income earned by the bottom 50 per cent increased in 2020 when India is removed from the analysis,” the report states.
Moreover, during the 40 years that have followed the pandemic, countries have become richer while their governments have become significantly poorer. “Public wealth is almost zero or negative in rich countries, meaning that the nation’s entire wealth is privately held.
After the Covid crisis, the government borrowed between 10 and 20 per cent of GDP, primarily from the private sector,” noted the report.
Additionally, the rise in private wealth has been inequal within countries and globally. For the past two decades, 38% of world wealth has been accumulated by the top 1%, while the bottom half has only got 2%.
Rich people have seen their wealth grow at a rate of 6 to 9% per year since 1995, but average wealth has grown at 3.2%. According to the report, the COVID pandemic contributed to this increase.
Global, regional trends
According to the report, just 2% of the global population is wealthy, while the richest 10% own 76%. The wealthiest 10% earn 52% of global income, while the poorest earn 8%.
Globally, the Middle East and North Africa are the unequal regions, while Europe is the least unequal, the report states. It is 36% in Europe, 58% in the Middle East and North Africa, 43% in East Asia, and 55% in Latin America.
A trillion euros was approximately 600% of national income in 2020 or around 510 trillion euros. Since the early 1990s, total wealth has grown from about 450% to about 600% of total revenue.
In 1970, the ratio of private wealth to national income ranged between 200-400% in high-income countries. These ratios averaged 550% by 2008 when the global financial crisis began.
Among other large emerging economies, China and India experienced faster economic growth after transitioning away from communism (in China and Russia) or a highly regulated financial system (in India). From 1980 to 2020, private wealth increased by 290% in India.
According to the report, inequality worldwide are on par with those at the peak of Western imperialism in the early 20th century.
Other key to inequality
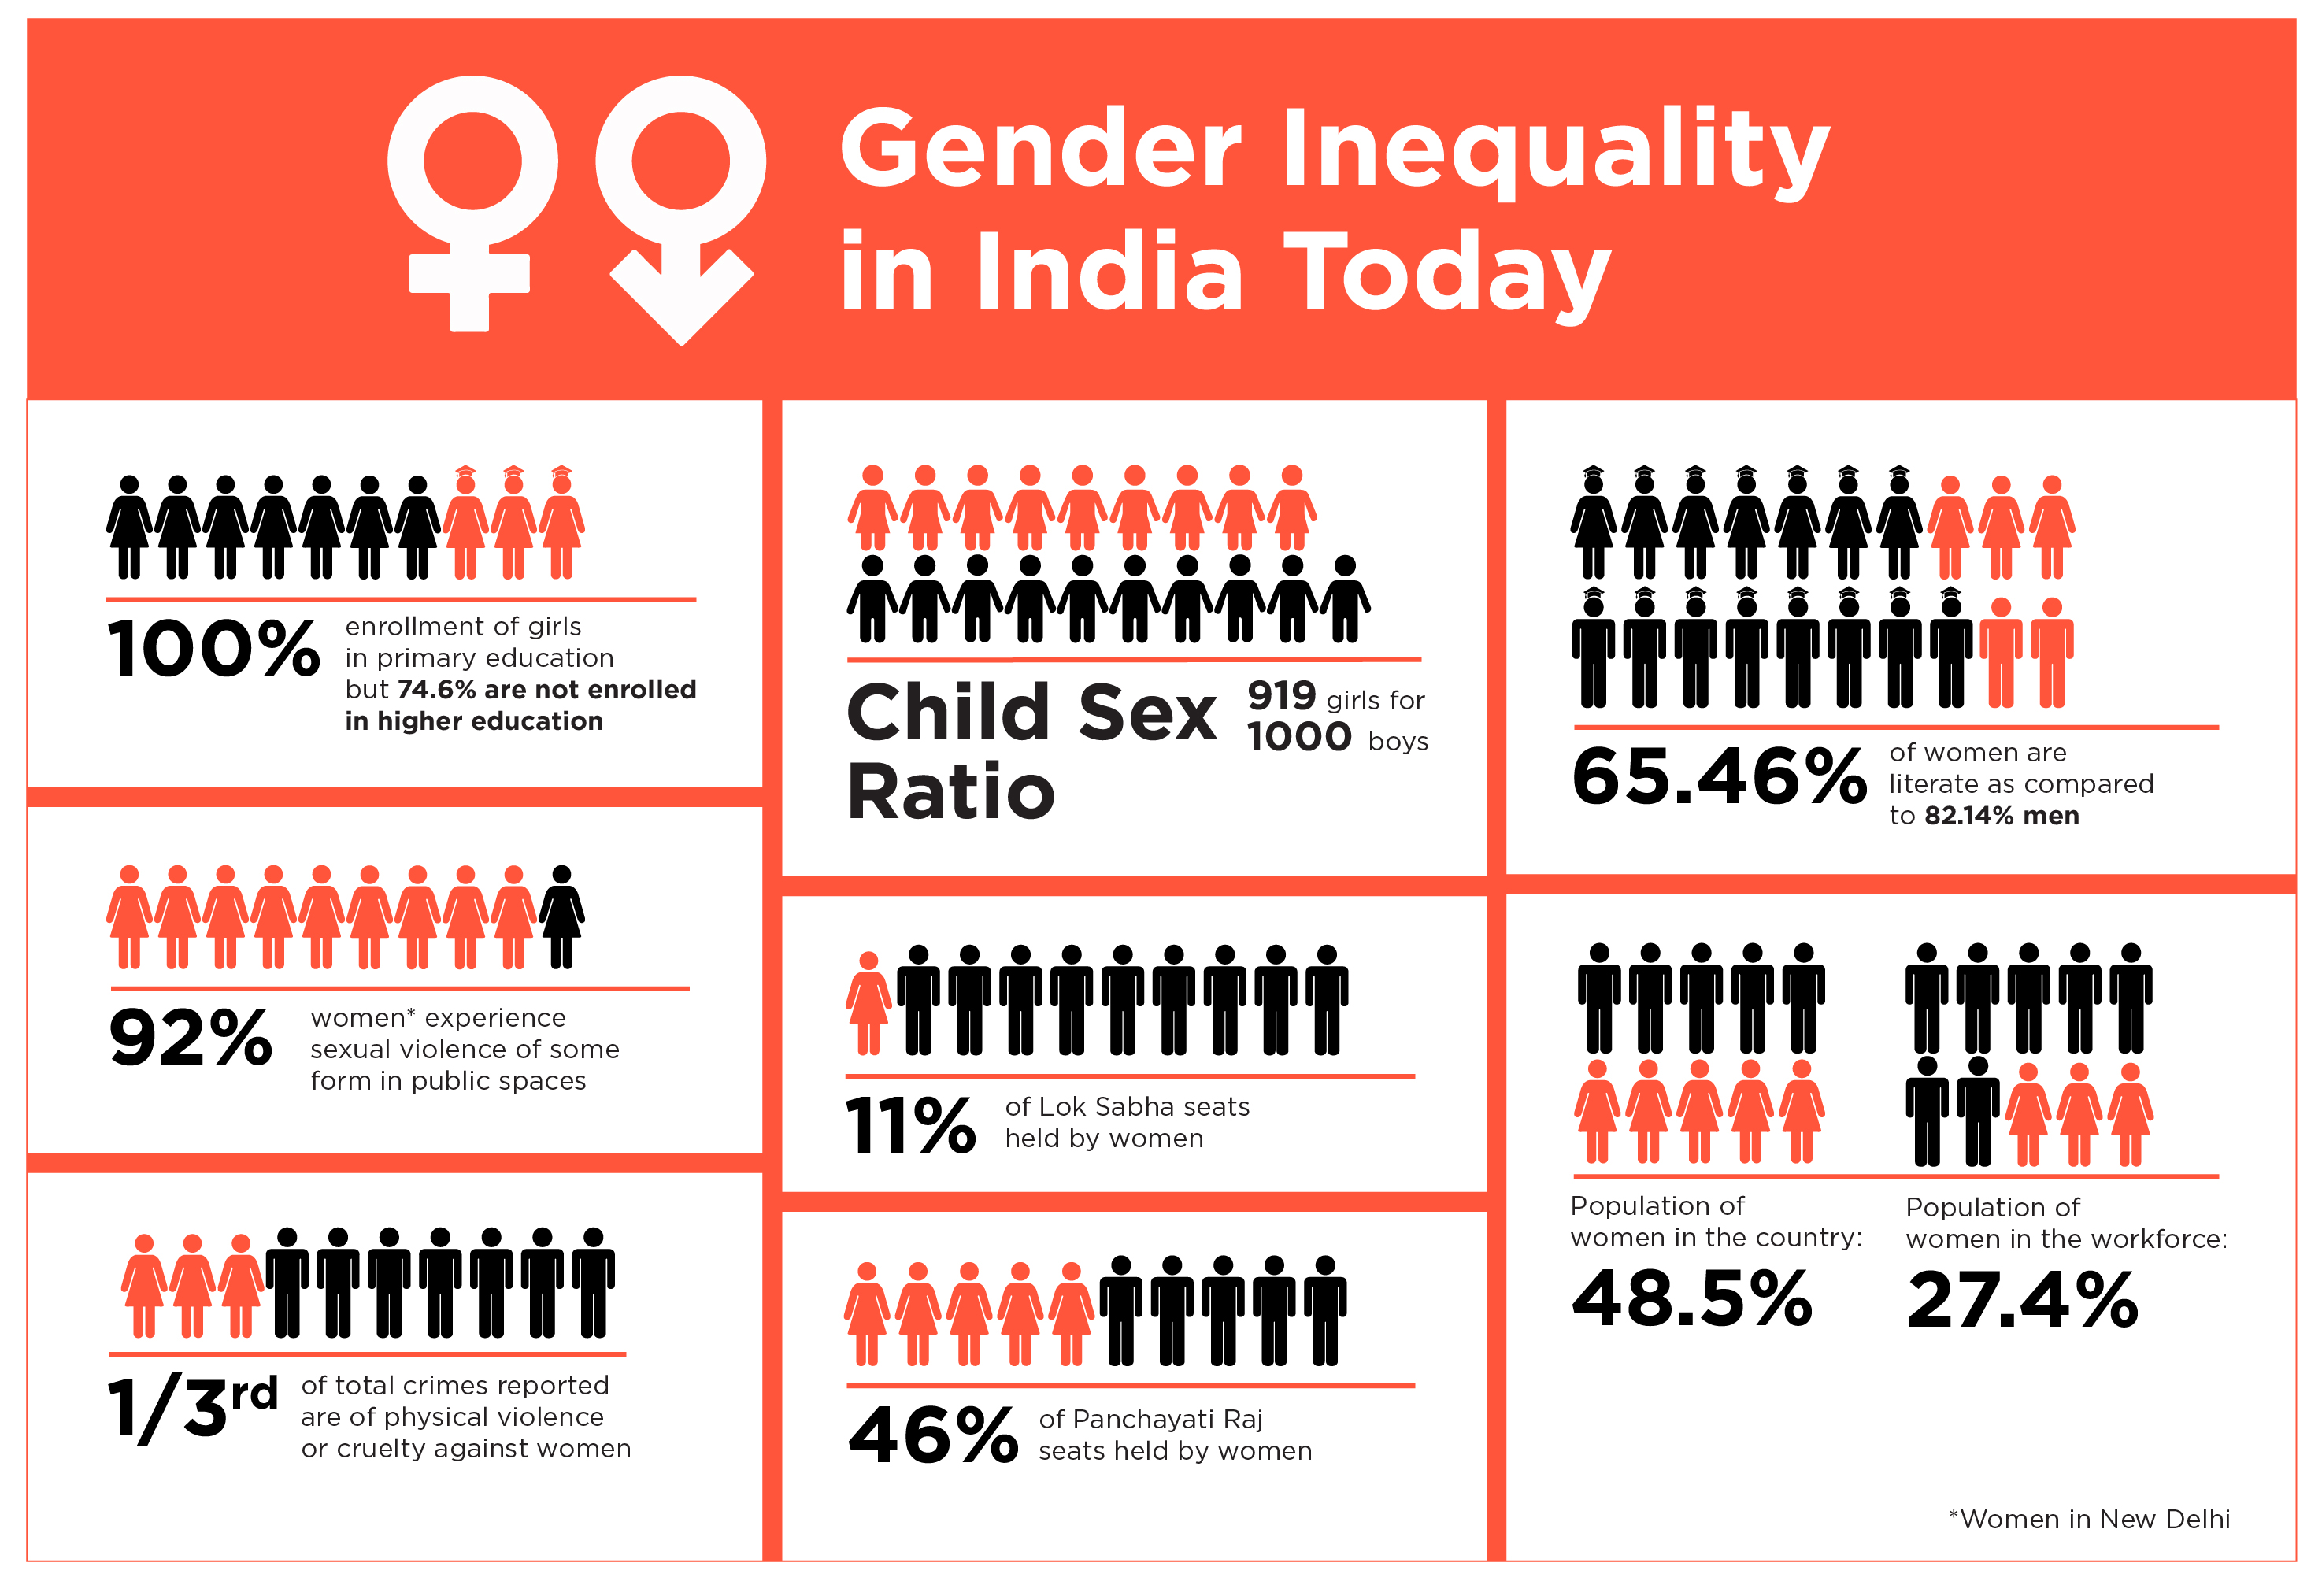
The report says that the percentage of women’s income from work dropped from about 30% in 1990 to less than 35% today.
The gap between countries is now more significant than the gap within them. Over the last century, the gap between the top 10% and the bottom 50% has nearly doubled from 18 times in 1820 to 41 times in 1910, rose to 53 times in 1980, 50 times in 2000, and then dropped to 38 times in 2020.
According to the report, global income and wealth inequalities are “closely associated with ecological inequality and inequality that contribute to climate change”. Close to 50% of all emissions come from the top 10% of emitters, while the bottom 50% contribute 12%.
If the rich were taxed

Multimillionaires may be subject to a modest progressive wealth tax, as suggested in the report.
At market exchange rates, 62.2 million people owned more than $1 million in 2021. A total of $174 trillion was their average wealth, $2.8 million.
More than 1.8 million households with more than $10 million in assets, 76,500 homes (0.001%) have more than 2750 people (0.00005%) own more than a billion dollars, but none own more than $100 million. Billionaires own three per cent of the world’s wealth.
The United Nations report said 2.1% of global income could be raised by taxing wealth above $1 million at an effective global rate of 1.2%. Tax rates of 0.6% and 1.1% can generate 0.4% and 0.3% of global income, respectively, for wealth up to $10 million, and 0.6% and 5% for wealth over $10 million.
Inequality in India as revealed by NFHS data
A wide range of discussion has accompanied the release of NFHS data (and the Niti Aayog’s study on developing a multidimensional poverty index – MPI) and is well deserved. Recognizing the basic parameters of improvement across multiple dimensions is the key to understanding progress and development.
Global studies of poverty have reached the third level with the MPI indices. A measure of absolute poverty was first developed by the World Bank using income and consumption data.
Through the Human Development Index (HDI), the UN added health and education indicators to the monetary index. Developed by Oxford University, the MPI is an exclusive, non-monetary measure of poverty.
A study of the inter-temporal evolution of poverty provides most of the information and helpful policy analysis used by the other poverty indices (World Bank and HDI). Niti Aayog’s detailed study of the 2015-16 financial year is an excellent source of data and analysis.
In addition to the 2019-21 data, unit-level data will be available later to allow a more in-depth analysis. It is possible to use these data to obtain a snapshot of a particular point in time. Time-frozen snapshots feature only a single point in time, not their evolution over time.
In recent days, expert commentary on the subject has revealed how one year (one point) data can be interpreted to imply trends over time – a definite no-no.
There is little analysis of inequality in an article by Ajit Ranade, but lots of static evidence for 2015-16: “The population of Uttar Pradesh is 37.8 per cent below the MPI poverty line; Kerala’s population is just 0.71 per cent below the poverty line.”
Ranade recognizes that regional inequalities have existed for a long time but argues that even if the MPI measures poverty incidence, it is still staggeringly unequal across states. I wonder if development outcomes have converged or diverged over time – not that they have been equalized, but if they have converged or diverged over time.
According to T N Ninan, the Sahel region in Africa and the Philippines in India exist simultaneously. Neither area is getting closer to the other. There is no doubt that India’s development trajectory hasn’t been uniform, although it’s impossible to determine the regional imbalance at a given point in time.
The NFHS data reveal quite the reverse in the summary statistics. In just five years, India has witnessed a remarkable convergence in living standards, one that may be unmatchable in the history of India.
As a reasonable proxy for the beginning of the Modi development model, we can take 2015-16 as the first point of comparison. Informed public policies targeted at quasi-public goods and the market play separate roles (increases in personal income).
For two years, 2015-16 and 2020-21, the NFHS reports the averages for 131 variables in all states. We construct four types of indices by using seventeen out of the 131 welfare indicators.
The first classification focuses on improving a girl’s or woman’s life (five indicators, such as sex ratios, fertility, education, etc.). In the second bucket, housing is considered (three indicators, such as improved sanitation, clean fuel).
Fourth is health (four indicators such as adequate diet and stunting), and fifth in women’s empowerment (five indicators, such as owning a home and less violence toward spouse).
In our evaluation, we use Niti Aayog’s NFHS-4 findings — i.e., the per cent change in indicators between NFHS-4 and NFHS-5 — as the baseline scenario since it relies primarily on the NFHS-4.
Several states are represented in the table. As an approximation of the former BIMARU states, plus a few more, the conditions are divided into poor and rich states.
Kerala, Punjab, and Tamil Nadu are examined to examine whether indicators have grown differently (convergence/divergence?).
A state-by-state hand has a value between 0 and 100. A time indicator has a value between 0 and 100. A state-by-state indicator is between the worst and best indicated by a ratio: The indicator value is the absolute distance from the minimum or maximum. The difference between the maximum and minimum is the denominator.
A possible score of 1,700 can be derived from 17 indicators. A minimal 1.5% increase over its 2015-16 value makes Kerala the best performer with an aggregate index of 1,300 in NFHS-5. By contrast, Bihar experiences a 56.5% increase.
On the other hand, Tamil Nadu has a lower index today – 1,178 in 2020-21 versus 1,240 in Punjab. The welfare index in UP (along with Rajasthan and MP) increased by more than five times as much as that in rich states over the past five years.
This index will be aggregated across a broader range of indicators soon. It is unlikely that the primary results will change – a significant increase in the development of 31 per cent, and a very marked decline in product inequality, as measured by the Gini coefficient, of 41 per cent.
There has been an astounding 48 per cent increase in female empowerment and a more than halving of the Gini coefficient.
Overall, most indicators were consistent. The convergence is vital, not convergence. The increased performance of less developed states indicates a catch-up process, which suggests regional imbalances are gradually reducing, and in some cases, rapidly. Some “developing” states are too close for comfort for states like Uttar Pradesh, Bihar, and Jharkhand for some indicators.
A targeted approach to improving developmental outcomes is responsible for the acceleration of catch up rather than a coincidence. To address the issue of inadequate sanitation, 110 million toilets have been constructed.
The PM Ujjwala Yojana, through which 86 million LPG connections were provided, also discussed the problem of asthma caused by the incomplete combustion of wood for cooking.
An entire region was developed holistically, not just by addressing individual household needs like sanitation, fuel, and electricity. A key aim was to identify the most disadvantaged districts in India and help them catch up with the country’s growth story by targeting public resources.
Not one, but several Indias have existed in India. There has been an unusual convergent and inclusive development pattern in recent history, with the poorer states making more progress than the more prosperous states. Those numbers tell the real story behind NFHS-4 and NFHS-5.